

This key moving average convergence is a strong signal that the market is shifting from bearish to bullish.
The most important aspect in trading is to correctly identify the long-term trend. Once this is done, the rest of the steps are not very difficult because all a trader needs to do is look for buying opportunities in an uptrend and selling opportunities in a downtrend.
In reality, many traders complicate the process by waiting for lower levels to buy in a bull market and missing a large portion of the rally. Then, when the trend reverses and the price starts falling, the same traders start buying, which usually results in losses.
To avoid this pitfall, traders can incorporate the use of key moving average convergence patterns in order to have a better gauge of market momentum and the direction of the trend. In last week’s article, we reviewed the Death Cross, and this week we will look at the golden cross pattern. This setup can help keep traders at bay in a downtrend and give them a green signal to start buying when the trend turns bullish.
Let’s investigate this pattern and learn how to use it when trading.
What is a golden cross and how does it form?
A golden cross is a setup that signals a possible change in a bearish downtrend. It is formed when a faster period moving average, usually the 50-day simple moving average, crosses above the longer-term moving average, generally the 200-day SMA.
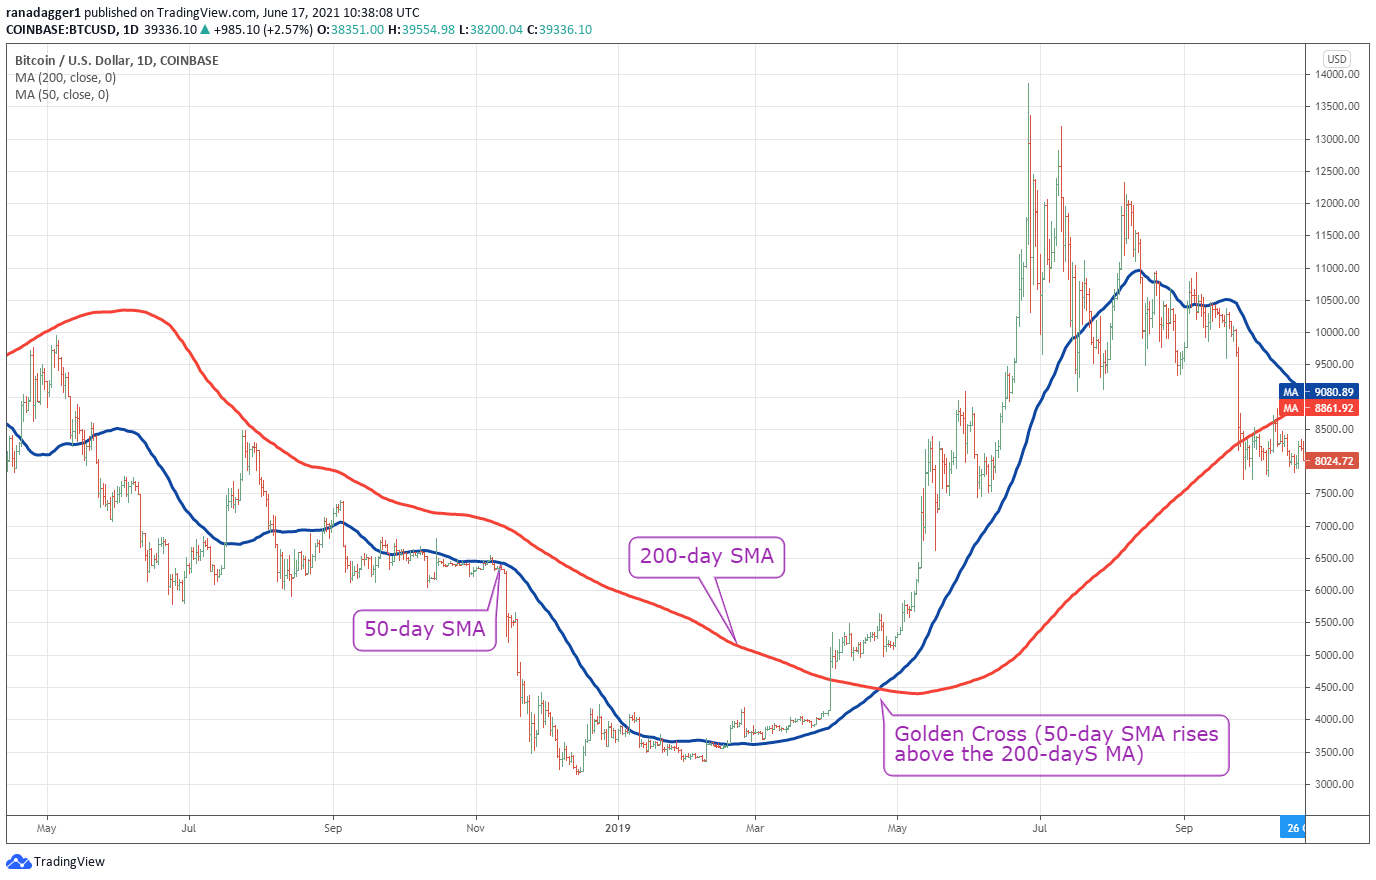
In a downtrend, both the 50-day SMA and the 200-day SMA are sloping down. However, when the price reaches an attractive valuation, long-term investors start accumulating, which arrests the pace of the decline. As more investors start buying, the trend starts to turn up.
A sustained up-move results in the 50-day SMA changing its direction from down to up. However, the 200-day SMA is slower to respond, hence when it is either falling or has flattened out, the 50-day SMA rises above it, forming the golden cross.
When a golden cross forms, it is a sign that the downtrend has ended and a new uptrend could have begun.
However, like every setup, the golden cross is not foolproof. It gives false signals several times but with a few filters, traders may reduce the whipsaws.
Related: Here’s 5 ways investors can use the MACD indicator to make better trades
A profitable golden cross
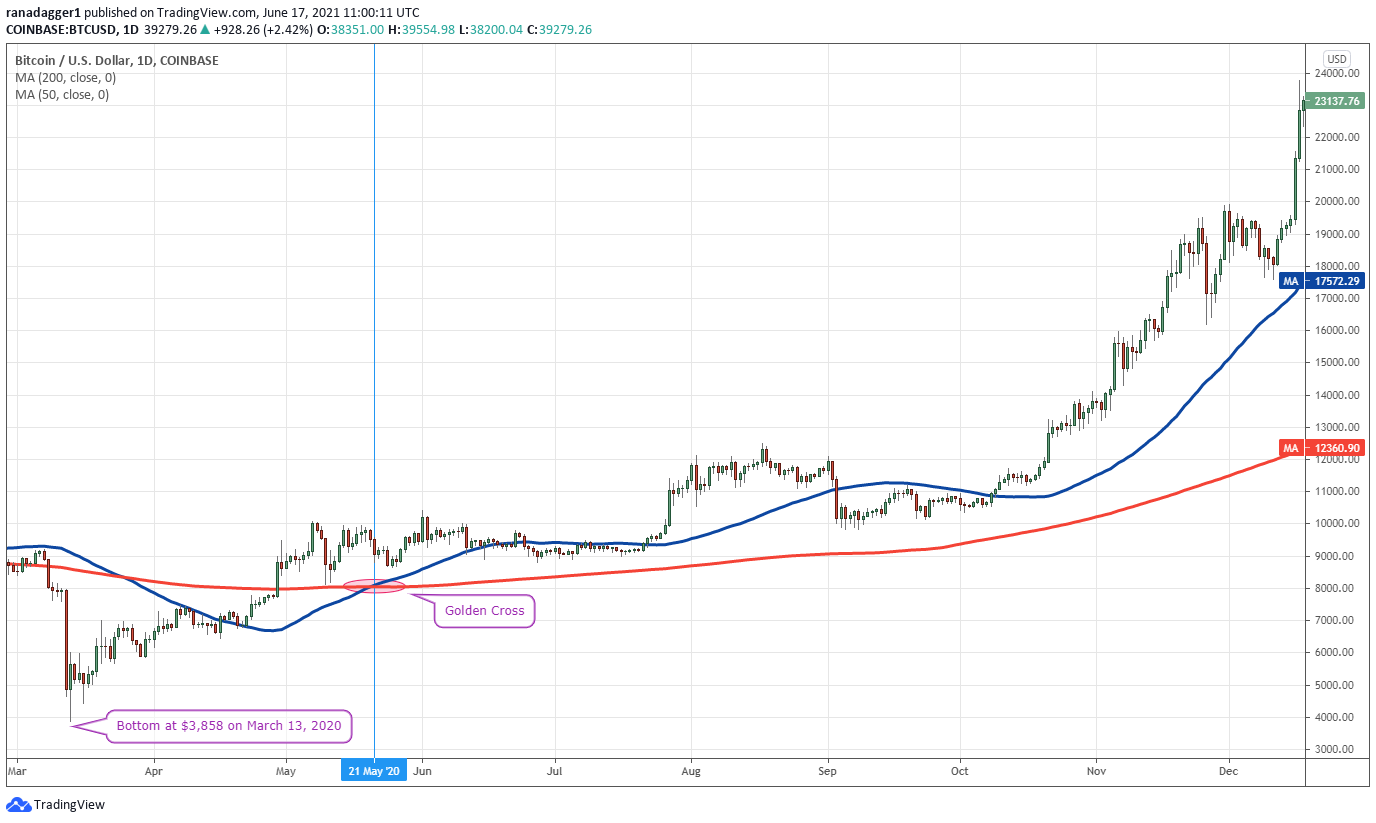
Bitcoin (BTC) bottomed out at $3,858 on March 13, 2020, and the most recent golden cross formed on May 21, 2020, when the price closed at $9,061.96. That means, the BTC/USD pair had already moved 134% from the lows by the time the golden cross confirmed a change in trend.
Inexperienced traders may have felt the price has run up too fast and would have waited for a deep correction to happen before buying. However, when a trend changes, it rarely gives an opportunity to buy at much lower levels as was the case here.
The rally never looked back and it hit an all-time high at $64,899 on April 14, 2021, a massive 616% gain from the level where the golden cross formed. This shows that the trader who just bought and held after the formation of the golden cross would have earned huge returns.
However, every golden cross does not provide such outsized returns and sometimes traders fall victim to whipsaws.
A failed golden cross
Bitcoin dropped from a local high at $13,868.44 on June 26, 2019, to a local low at $6,430 on Dec. 18, 2019. The golden cross formed on Feb. 18, 2020, when the pair closed at $10,188.04.
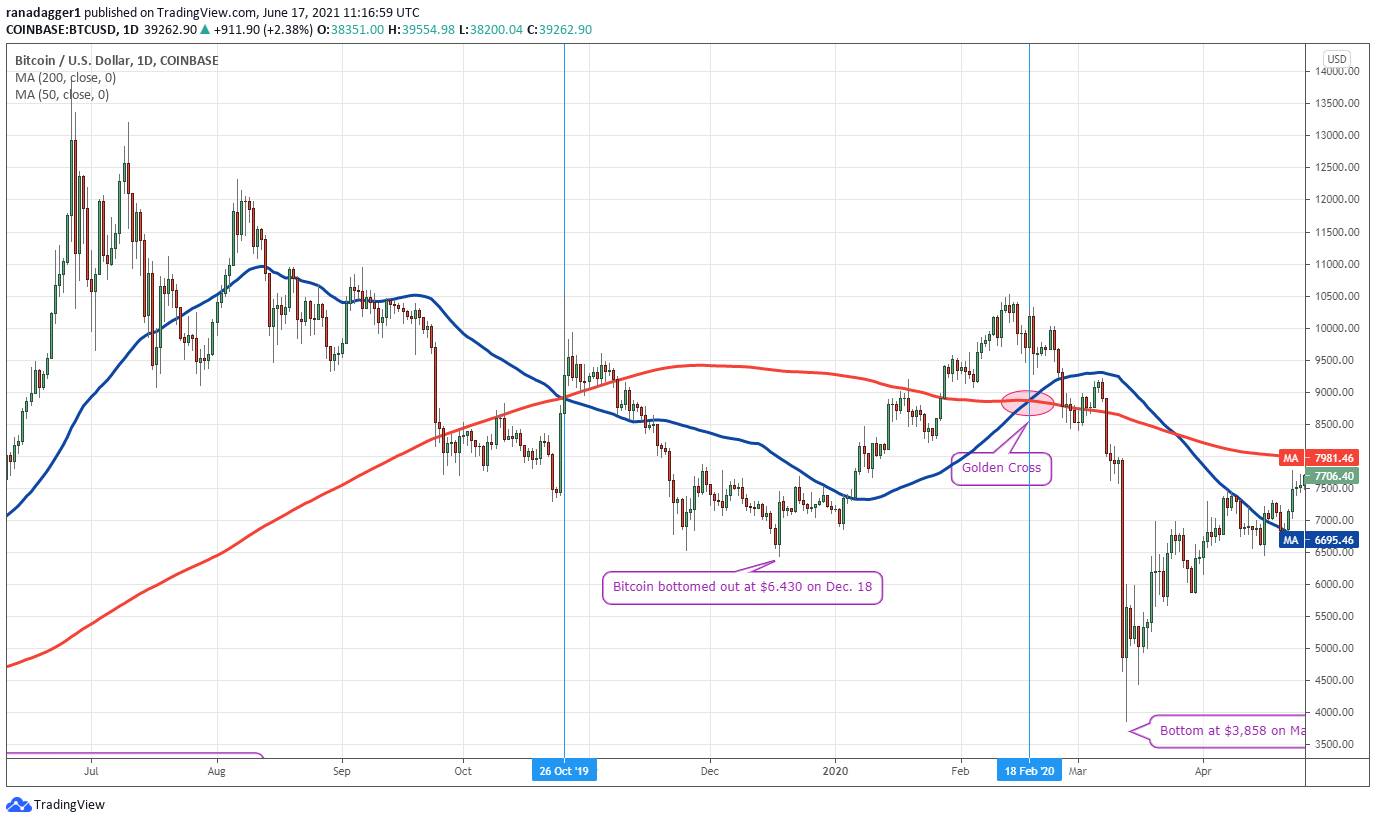
However, traders who bought after the golden cross formed may have suffered quick losses as the pair plummeted to $3,858 just a few days later. This shows how traders may sometimes get caught on the wrong foot by just buying after the golden cross.
Related: Unsure about buying the dip? This key trading indicator makes it easier
Filters can when the golden cross throws a false signal
Traders could avoid buying if the golden cross forms when the 200-day SMA is still sloping down. They can wait for the 200-day SMA to flatten out or turn up before buying as that may reduce the whipsaws.
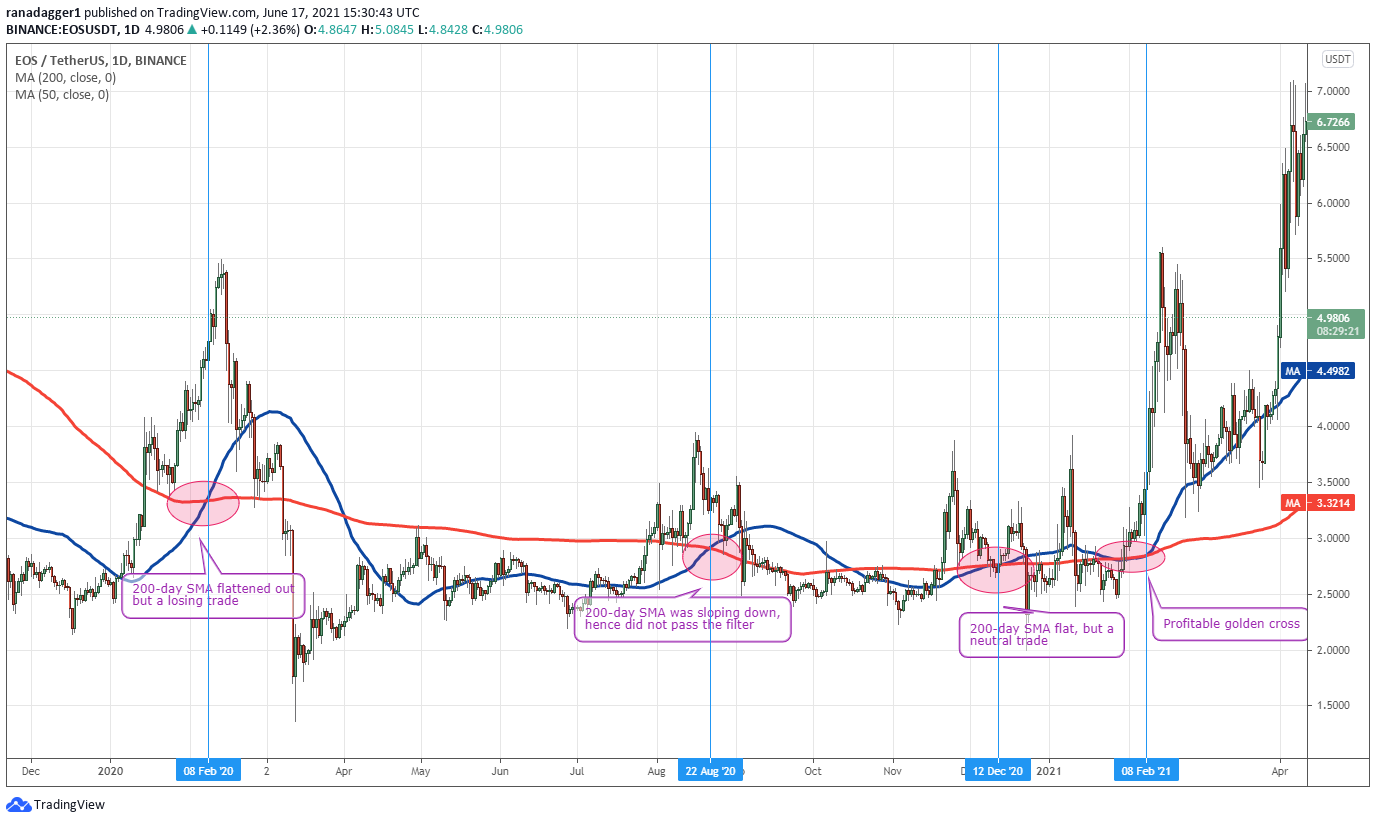
As an example, EOS formed a golden cross pattern on Feb. 8, 2020 when the price was at $4.76. This price cleared the filter as the 200-day SMA had flattened out. However, had traders taken the trade, it would have turned into a loss as the EOS/USDT pair topped out at $5.49 on Feb. 17, 2020, and then plunged sharply to $1.35 on March 13, 2020.
The second golden cross on Aug. 22, 2020, did not clear the filter as the 200-day SMA was sloping down when the pattern formed. This would have kept the bulls from getting sucked into this trade.
The third golden cross on Dec. 12, 2020, cleared the filter but it would have hit the stop-loss as it breached the strong support at $2.20 on Dec. 23, 2020. Finally, the fourth golden cross that formed on Feb. 08, 2021, turned out to be profitable.
The above example shows that when the price is stuck in a range, the golden cross does not act as the ideal indicator. Therefore, traders may add another filter to buy only after the price breaks out of the range. This may reduce the whipsaws further and help traders buy only in uptrends.
When a cryptocurrency is in a downtrend, traders may wait for the golden cross to occur before starting their purchases. This could keep traders out of trouble in a falling market.
After the golden cross sustains and a new uptrend is confirmed, traders may look for buying opportunities. Among the many possibilities, one that was highlighted in an earlier article to buy on dips to the 20-day EMA or the 50-day SMA could come in handy.
Key takeaways
A golden cross can confirm that a downtrend has ended and a new uptrend could have begun. Until a golden cross forms, long-term investors may avoid cherry-picking as that may result in losses in a downtrend.
However, like every other pattern, the golden cross is not perfect. It may result in whipsaws if the coin enters a consolidation during the bottoming formation. Therefore, traders must take precautions to avoid being sucked into bull traps.
Once the uptrend is established after the golden cross, traders may look for buying opportunities and stay with the trend till a reversal is signaled.
The views and opinions expressed here are solely those of the author and do not necessarily reflect the views of Cointelegraph.com. Every investment and trading move involves risk, you should conduct your own research when making a decision.
Go to Source
Author: Rakesh Upadhyay