
Bitcoin’s consolidation near $50,000 reflects a steady market and this could attract buyers to altcoins like ADA, LUNA, VET and XTZ.
On Aug. 27, U.S. Federal Reserve Chair Jerome Powell said that the central bank will start tapering its $120 billion monthly bond purchases by the end of the year, but the interest rate hikes would have to wait until the job market and inflation pass a more stringent test.
In response to the speech, the U.S. dollar index (DXY) fell, the S&P 500 index rose to a new all-time high, and Bitcoin (BTC) surged about $1,500 in under an hour. This showed that market participants viewed the speech as “dovish.”
Bitcoin’s uncertainty near the $50,000 mark has analysts divided about its short-term directional move. Analyst Ryan Clark believes the current consolidation in Bitcoin is similar to the one seen below $24,000 before the breakout in December 2020, but TraderXO believes that BTC may correct to the $39,000 the to 42,000 zone in September.
Will Bitcoin’s consolidation below $50,000 attract buying in altcoins? Let’s study the charts of the top-5 cryptocurrencies that may outperform in the next few days.
BTC/USDT
Bitcoin bounced off the 20-day exponential moving average ($46,823) on Aug. 27 but the bulls have not been able to push the price above the overhead resistance zone at $50,000 to $50,500. This suggests that bears have not thrown in the towel yet.
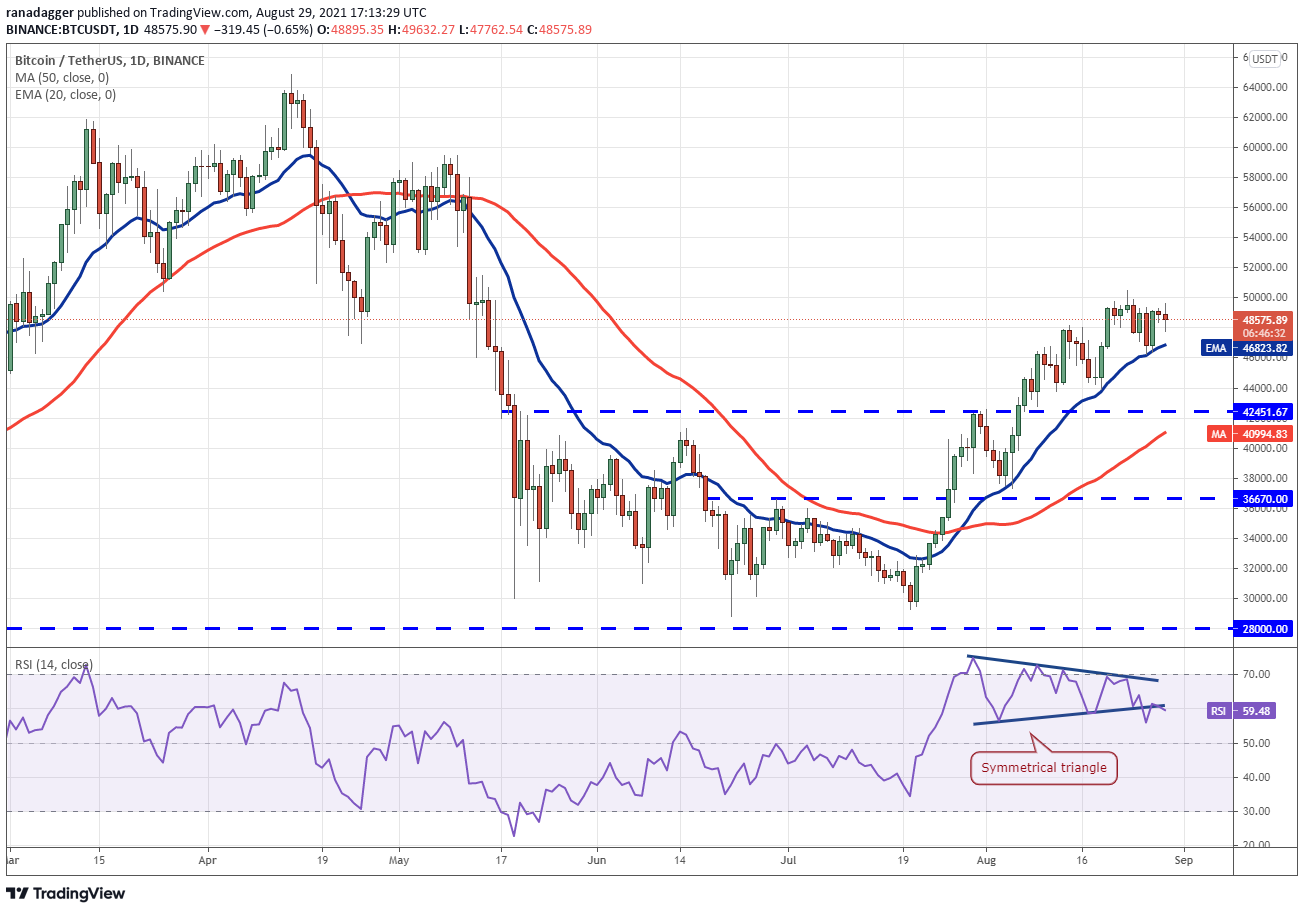
If the price turns down from the current level and slips below the 20-day EMA, it will suggest that the short-term traders are booking profits. That may pull the price down to $43,927.70 and then to $42,451.67.
If the price rebounds off this support, the BTC/USDT pair may remain range-bound between $42,451.67 and $50,500 for a few more days.
Alternatively, if the price turns up from the current level or bounces off the 20-day EMA, the bulls will again try to thrust the price above the overhead zone. If they manage to do that, the pair may start its journey toward $60,000.
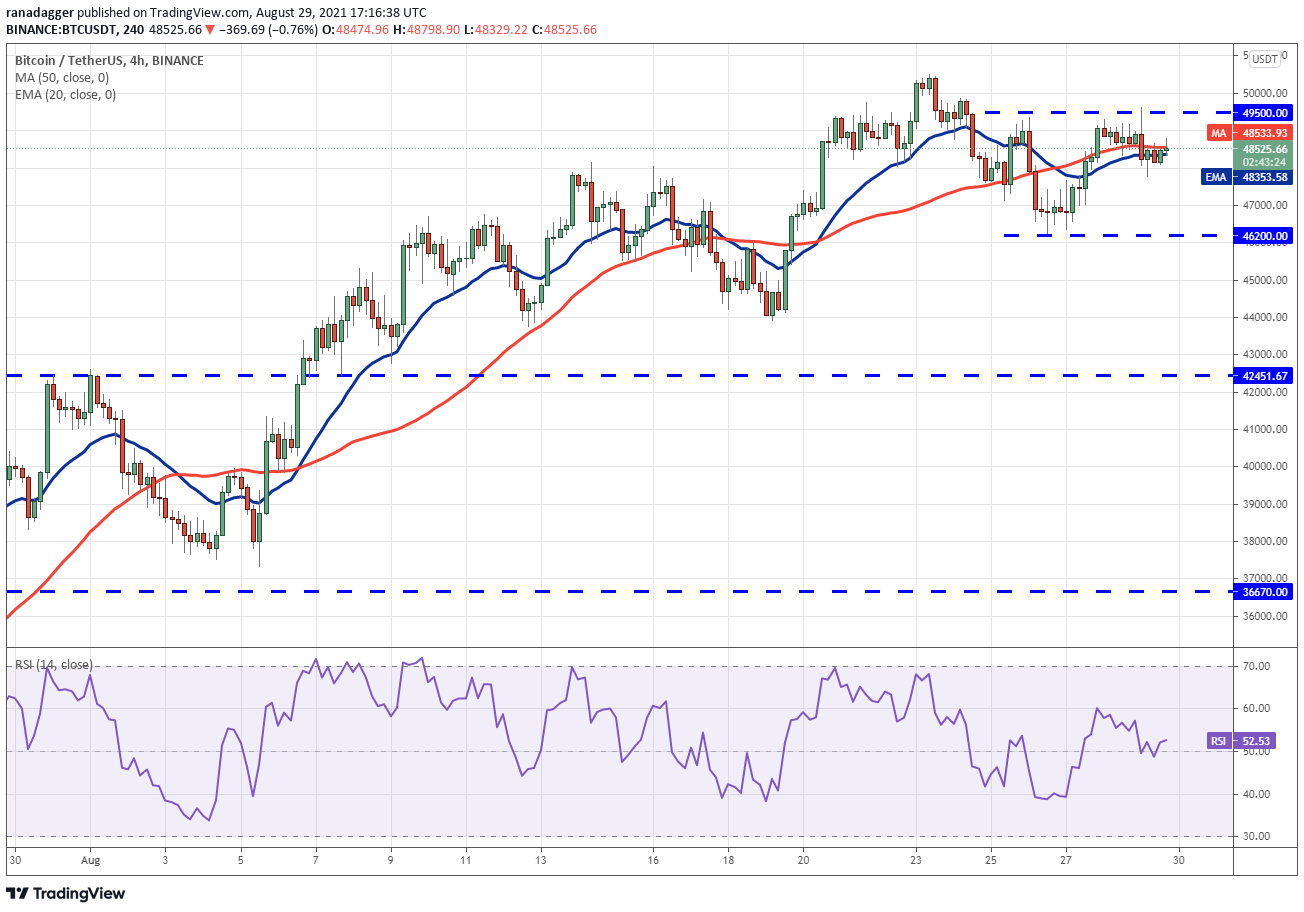
The moving averages on the 4-hour chart have flattened out and the relative strength index (RSI) is close to the midpoint, indicating a range-bound action in the near term. The price may remain stuck between $46,200 and $49,500 for some time.
If bulls drive the price above $49,500, the pair may challenge the $50,500 resistance. A breakout and close above this level could signal the start of the next leg of the uptrend. On the contrary, if bears sink the price below $46,200, the pair may drop to $44,000.
ADA/USDT
Cardano (ADA) is currently consolidating between $2.97 and $2.47. The price had dropped to the breakout level at $2.47 on Aug. 26 but the sharp rebound off it on Aug. 27 shows that bulls have flipped the level into support.
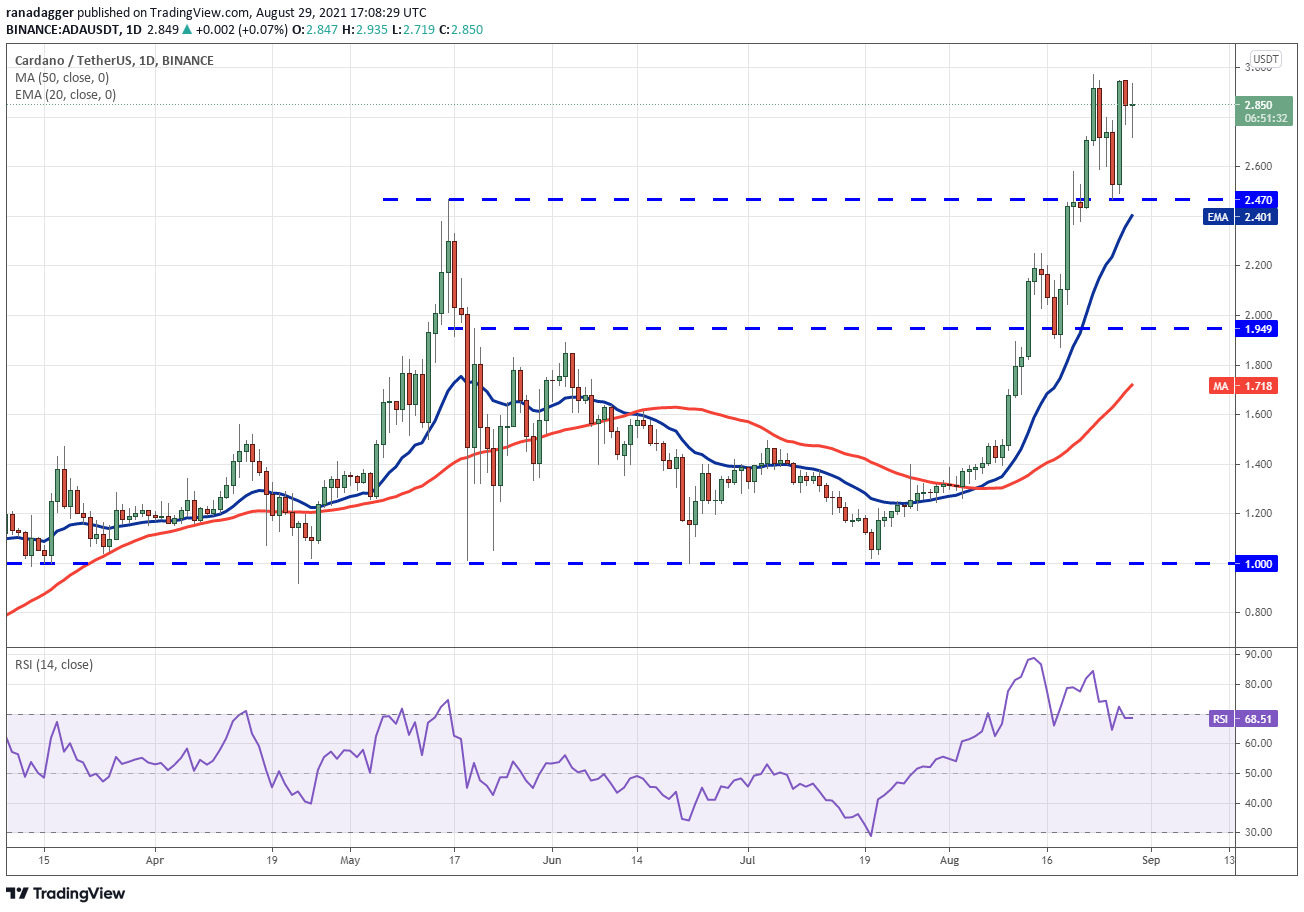
A consolidation near the all-time high is a positive sign as it shows that traders continue to buy on dips. Both moving averages are sloping up and the RSI is near the overbought territory, indicating that the path of least resistance is to the upside.
If buyers drive and sustain the price above the psychological barrier at $3, the ADA/USDT pair could resume its uptrend. The next target objective on the upside is $3.50.
Contrary to this assumption, if the price turns down from the $2.97 to $3 resistance zone, the pair may extend its stay inside the range for a few more days. A break and close below $2.47 will suggest that the bullish momentum has weakened.
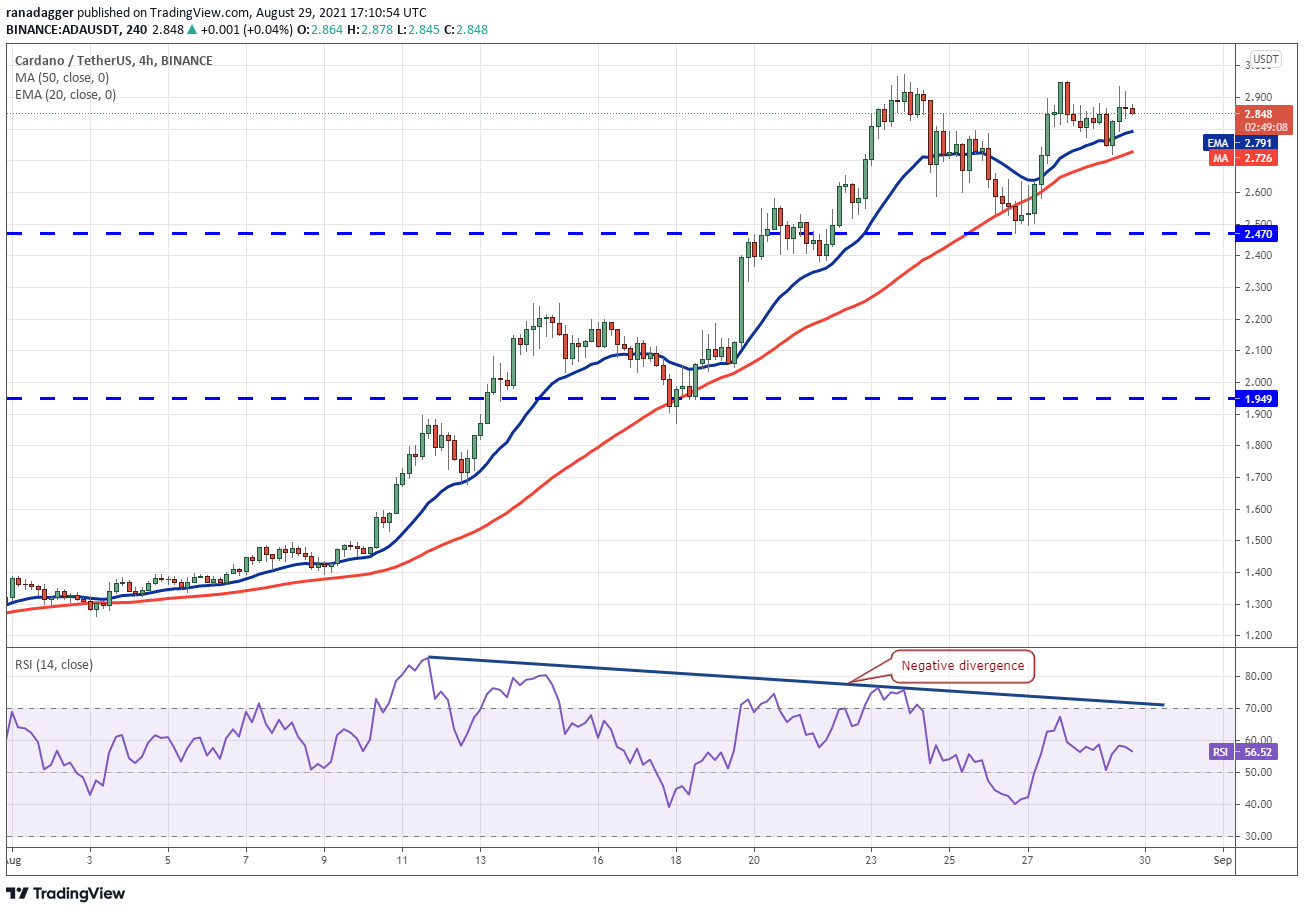
The RSI on the 4-hour chart has formed a negative divergence, indicating that the upward momentum may be slowing down. If bears pull and sustain the price below the 50-simple moving average, the pair may drop to $2.47.
A strong bounce off this support could keep the pair range-bound between $2.47 and $2.97 for some time. The bears will have to sink the price below the $2.47 to $2.31 support zone to gain the upper hand. Alternatively, the uptrend may resume if bulls drive and sustain the price above $2.97.
LUNA/USDT
Terra protocol’s LUNA token is in a strong uptrend. After a few days of consolidation, the price rebounded off the 20-day EMA ($26.42) on Aug. 27, indicating that the sentiment remains positive.
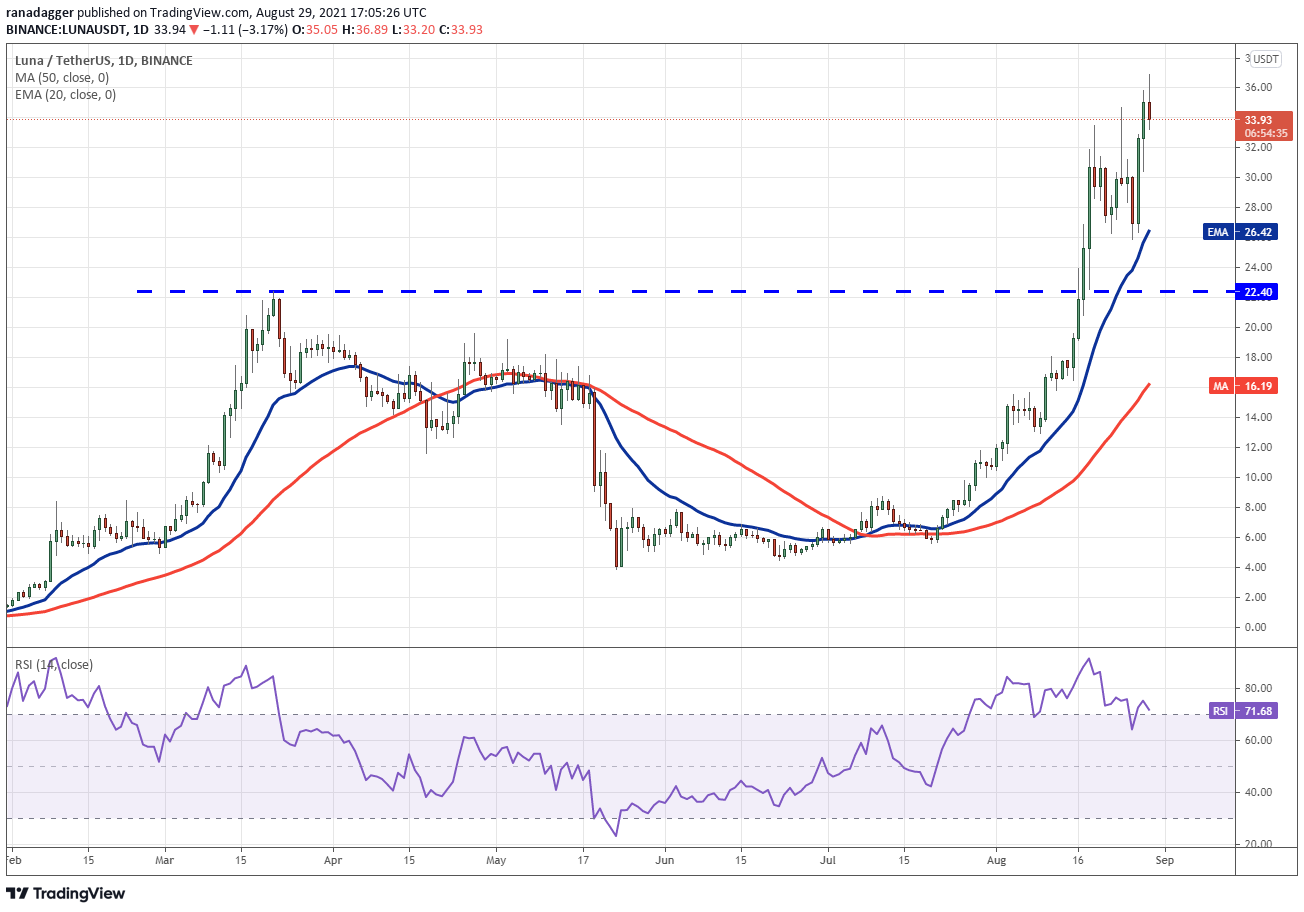
The upsloping moving averages and the RSI in the overbought territory indicate that bulls have the upper hand. The first target objective on the upside is a move to $43 and if that level is crossed, the LUNA/USDT pair may rally to $50.
However, the long wick on today’s candlestick suggests that bears are defending the overhead resistance aggressively. If bears pull the price below $32, the pair could drop to the 20-day EMA.
This is an important level for the bulls to defend. A strong bounce off it will suggest that the uptrend remains intact but a break below the 20-day EMA will indicate that the bullish momentum has weakened.
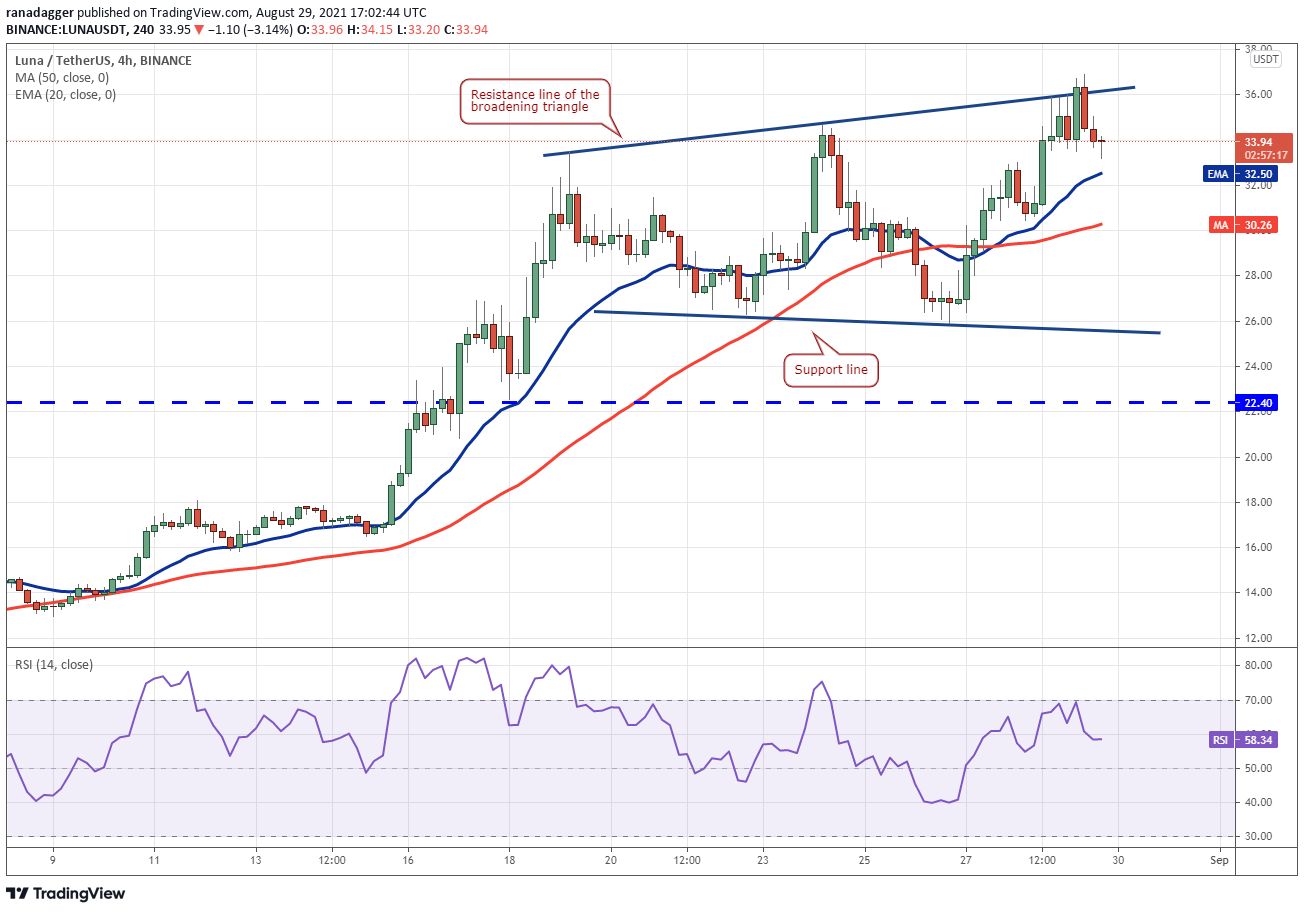
The 4-hour chart shows a broadening triangle formation which indicates an increase in volatility. The buyers had pushed the price above the triangle but they could not sustain the breakout, suggesting aggressive selling by the bears at higher levels.
If the price rebounds off the 20-EMA, the bulls will again make one more attempt to clear the overhead hurdle. If bulls sustain the price above the triangle, it may signal the resumption of the up-move. The pattern target of this setup is $46.95.
Alternatively, if the price breaks below the moving averages, the pair could drop to the support line of the triangle. A break and close below this support will signal that bears have overpowered the bulls. The pair may then drop to the $22.40 to $20.81 support zone.
VET/USDT
After the sharp recovery from its recent lows at $0.05 on July 21, VeChain (VET) has formed a pennant. This setup will complete after the price breaks above or below the formation.
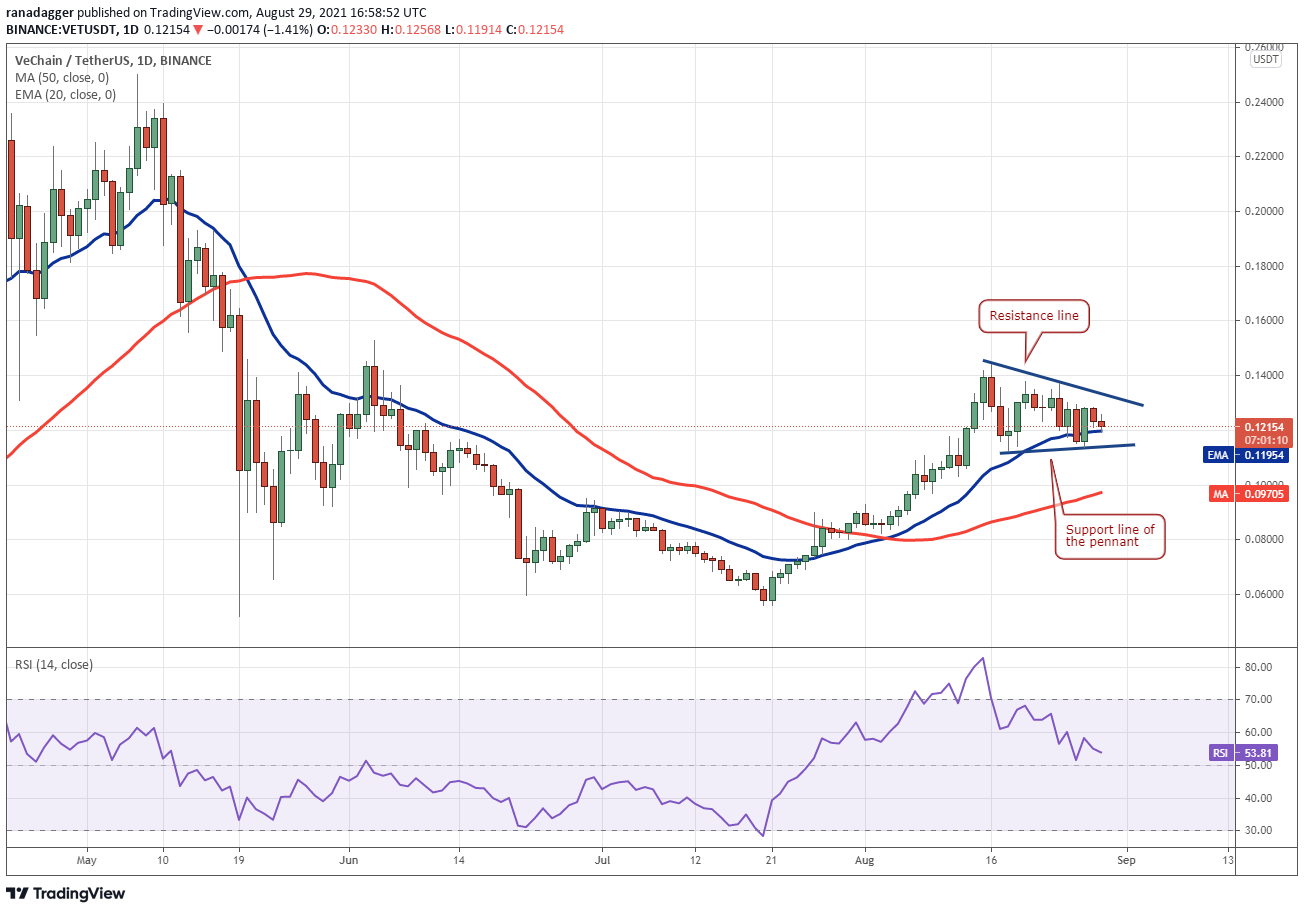
The 20-day EMA ($0.11) has flattened out and the RSI has dropped close to the midpoint, suggesting a balance between supply and demand. A breakout and close above the resistance line of the pennant will suggest the resumption of the up-move.
The first target objective on the upside is a move to $0.16 and if this level is crossed, the VET/USDT pair may rally to $0.19.
Conversely, if the price breaks below the support line of the pennant, the bullish view will be negated. The pair could then decline to the 50-day SMA ($0.09).
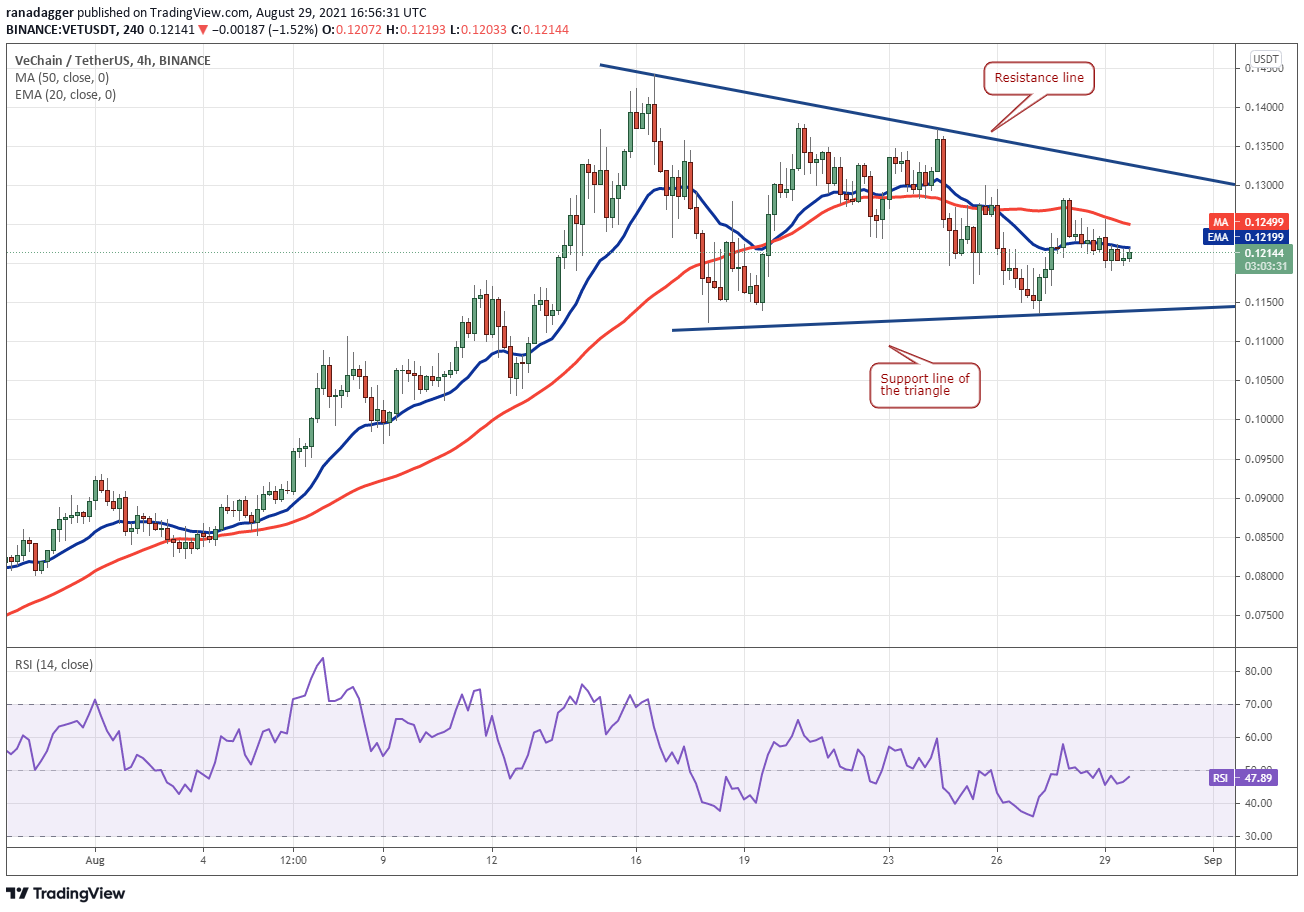
The 4-hour chart shows the price is getting squeezed inside the triangle. Both moving averages are flat and the RSI is just below the midpoint, which does not give a clear advantage either to the bulls or the bears.
The rebound off the support line is facing stiff resistance at the 50-SMA. If the price turns down from the current level, the bears will try to sink the pair below the support line. If they succeed, the pair may drop to $0.082.
On the other hand, if bulls drive the price above the 50-SMA, the pair could challenge the resistance line. A breakout and close above this resistance could signal the resumption of the up-move.
Related: Bitcoin weekly outlook: Why a $50K-retest is likely ahead of Friday’s US jobs data
XTZ/USD
Tezos (XTZ) completed a rounding bottom pattern when the price broke and closed above the overhead resistance at $4.47. This suggests the start of a new uptrend that has a pattern target at $6.85.
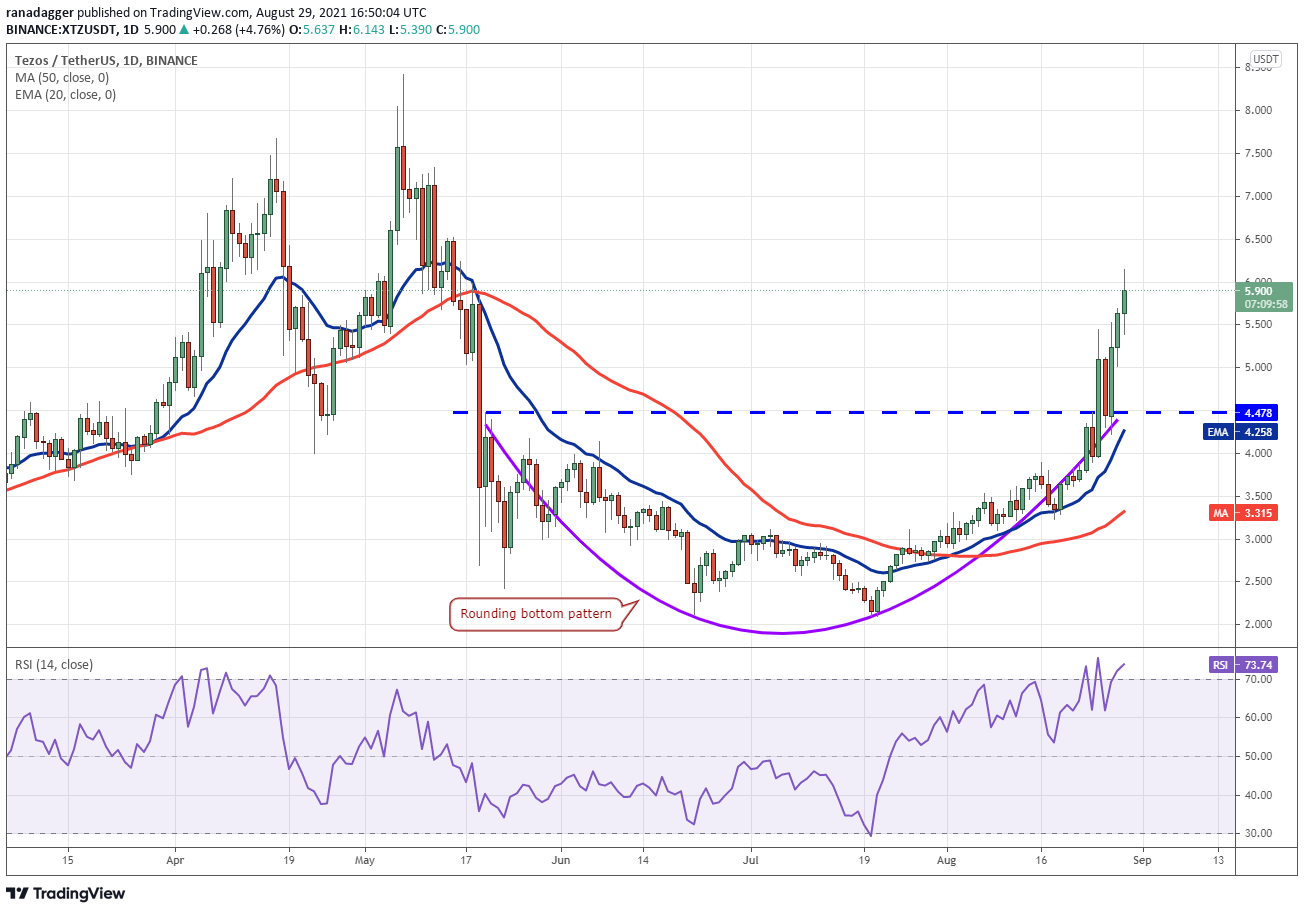
Usually, after the price breaks out of a setup, it retests the breakout level. In this case, the XTZ/USDT pair could drop to $4.47. If bulls flip this level into support, it will suggest the start of a new uptrend. The rising 20-day EMA ($4.25) and the RSI in the overbought zone indicate advantage to buyers.
Contrary to this assumption, if the price turns down from the current level and breaks below the 20-day EMA, it will suggest that supply exceeds demand. That could trap several aggressive bulls and result in a decline to the 50-day SMA ($3.31).
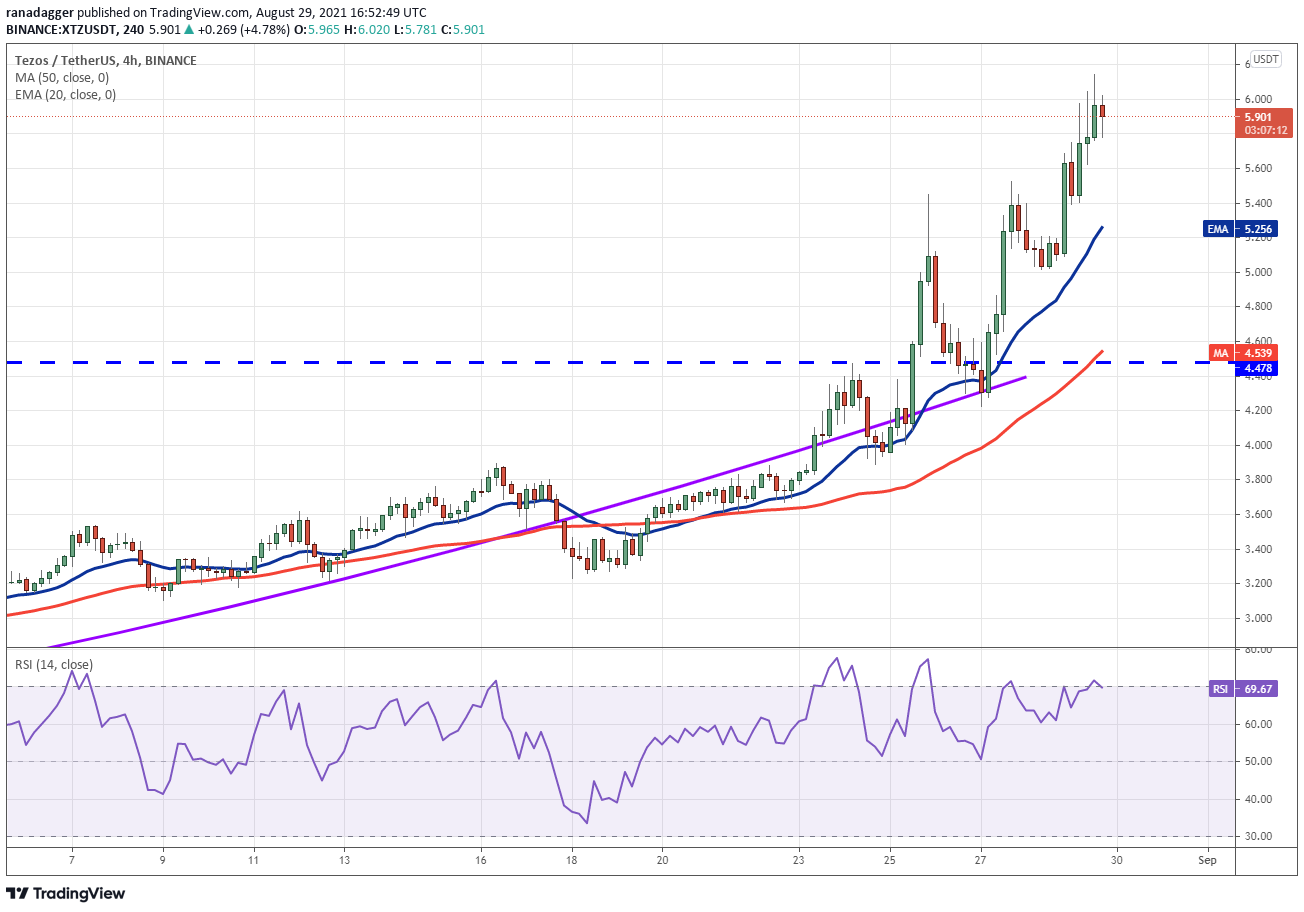
The 4-hour chart shows that the pair picked up momentum after it rose above the $4.47 resistance. Both moving averages are sloping up and the RSI is near the overbought zone, indicating that bulls have the upper hand.
The pair could rally to the overhead resistance zone at $6.31 to $6.50 where bears may mount a stiff resistance. The first sign of weakness will be a break and close below the 20-EMA. That could open the doors for a decline to the breakout level at $4.47.
The views and opinions expressed here are solely those of the author and do not necessarily reflect the views of Cointelegraph. Every investment and trading move involves risk, you should conduct your own research when making a decision.
Go to Source
Author: Rakesh Upadhyay