

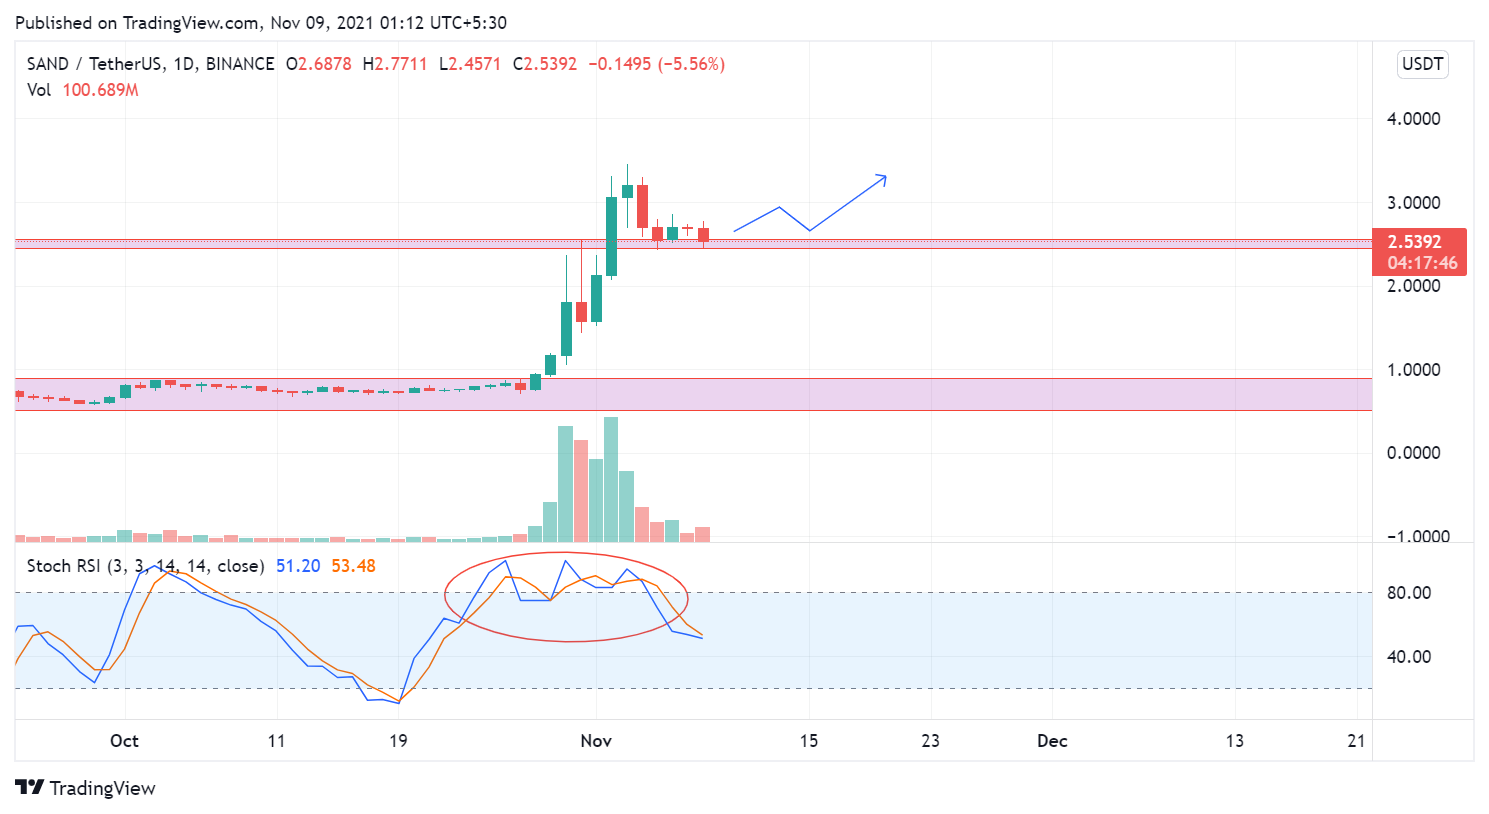
Sand (SAND/USD) has surged by over 130% in October and has already surged by over 60% in November. Sand is a very strong coin fundamentally and has recently rallied due to the Metaverse rebranding of Facebook. However, after the rally in November, Sand has already corrected by over 25% since its high of $3.4 and was over 5% in the red on Monday.
-
After the sharp rally in November, the RSI came in the overbought zone, however, the RSI has started slowly falling and a bounce-back could be expected soon.
-
A huge breakout was seen after a very long accumulation in price thus Sand could still give a huge rally.
-
Sand is back at an important demand zone now and this could be the make or break zone for Sand, if a bounce back is seen, a new all-time high could be seen.
-
If the zone is broken, Sand could fall down to $2.
-
Investors must be cautious as Sand has surged in price in a very short period of time thus it has formed very few support levels thus a stop loss must be maintained at $2.089.
-
It has also taken support from the 0.382 Fibonacci level which is indicating that it is looking very bullish for the coming weeks.
-
A long entry could be taken once a clear reversal is seen and not before as Sand could still break out from the crucial support zone at $2.43.
Conclusion
The bulls could be coming back to Sand very soon and could take it to a new all-time very soon. However, investors must take caution as Sand could still break down from the support zone it is at as it has not given a clear reversal yet.
The post Is the correction over in sand? Charts indicating towards a reversal soon appeared first on The Home of Altcoins: All About Crypto, Bitcoin & Altcoins | Cointext.com.
Go to Source
Author: Ansh Rathod