
Ethereum derivatives data highlights the lack of short-term strength as ETH price lags Bitcoin’s recovery to the $40,000 range.
While speaking at the Virtual Fintech Forum in Hong Kong on May 27, Ethereum co-founder Vitalik Buterin commented on obstacles related to the Ethereum 2.0 rollout. Buterin said that there had been several internal team conflicts in the past five years and as a result, he confirmed that Ethereum 2.0 launch is unlikely to occur before late 2022.
In a May 22 report from Goldman Sachs, analysts said that Ether has a “high chance of overtaking Bitcoin as a dominant store of value.” Furthermore, the report noted the growth of the decentralized finance (DeFi) sector and the nonfungible token (NFT) ecosystems being built on Ethereum. Coincidentally, on the very next day, Ether’s price bottomed at $1,750.
On June 14, CoinShares released its weekly fund flows report and Ether investment products had the largest outflows, totaling $12.7 million.
However, the upcoming $1.5 billion options expiry on June 25 could be a turning point for Ether, according to Cointelegraph. This figure is 30% larger than the March 26 expiry, which took place as Ether’s price plunged 17% in five days and bottomed near $1,550.
Despite flirting with $2,600 after a 12% rally over the past week, top Ether traders seem unable to change their neutral-to-bearish positioning according to derivatives data.
The 3-month futures premium is neutral-to-bearish
Normally, Tte 3-month futures will usually trade at a premium to regular spot exchanges. In addition to the exchange liquidity risk, the seller is postponing settlement and usually charges more.
The 6% to 17% annualized return on stablecoin lending indicates bullishness whenever the 3-month premium trades above that range. On the other hand, when futures are trading below the stablecoin lending rate, it is a signal of short-term bearish sentiment.
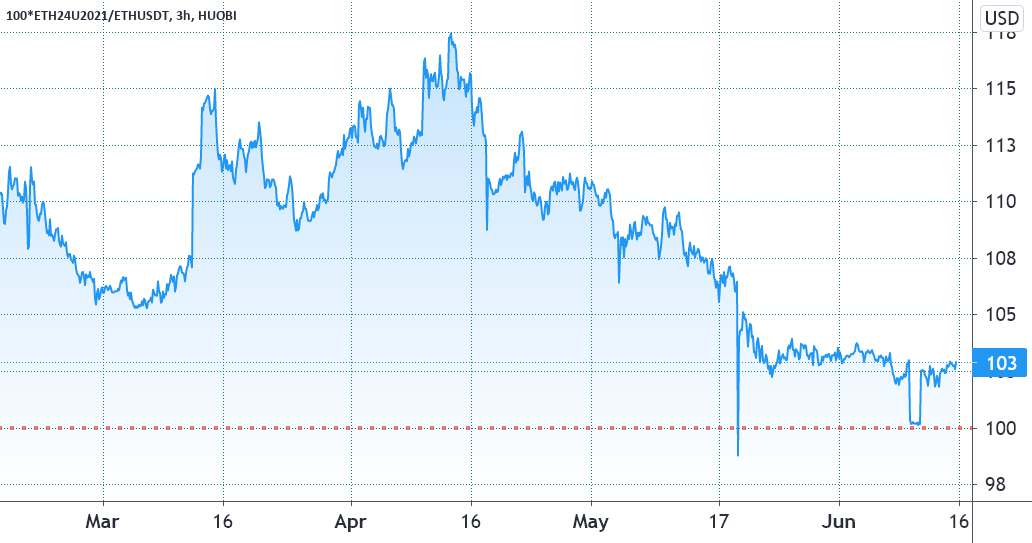
As shown above, the 8% premium — 26% annualized — vanished on May 13, indicating extreme optimism. Since then, it has been ranging near 2.8%, which is equivalent to 10% annualized. Thus, top traders are neutral-to-bearish according to this indicator as it nears the lower level of the expected range.
The options skew shows moderate signs of fear
The 25% delta skew compares similar call (buy) and put (sell) options and will turn positive when the protective put options premium is trading higher. Whenever this metric surpasses 10%, it is considered a “fear” indicator.
The opposite holds when market makers are bullish and this causes the 25% delta skew indicator to enter the negative range
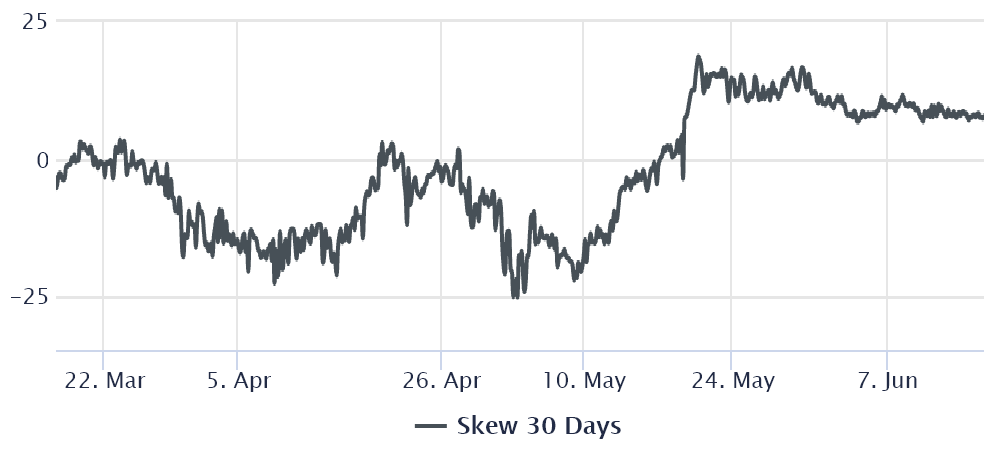
From May 20 to June 8, the indicator stood near 10%, indicating a higher protective put premium, which is usually a ‘fear’ indicator. However, over the last week, it has slightly improved to 7%, within the “neutral” range, but still close to bearish sentiment.
There is no evidence of bullish growth in top traders’ confidence as Ether tests the $2,600 resistance. So until those indicators flip to neutral-to-bullish, traders should act with extreme care before concluding that a bull run is in place.
The views and opinions expressed here are solely those of the author and do not necessarily reflect the views of Cointelegraph. Every investment and trading move involves risk. You should conduct your own research when making a decision.
Go to Source
Author: Marcel Pechman
