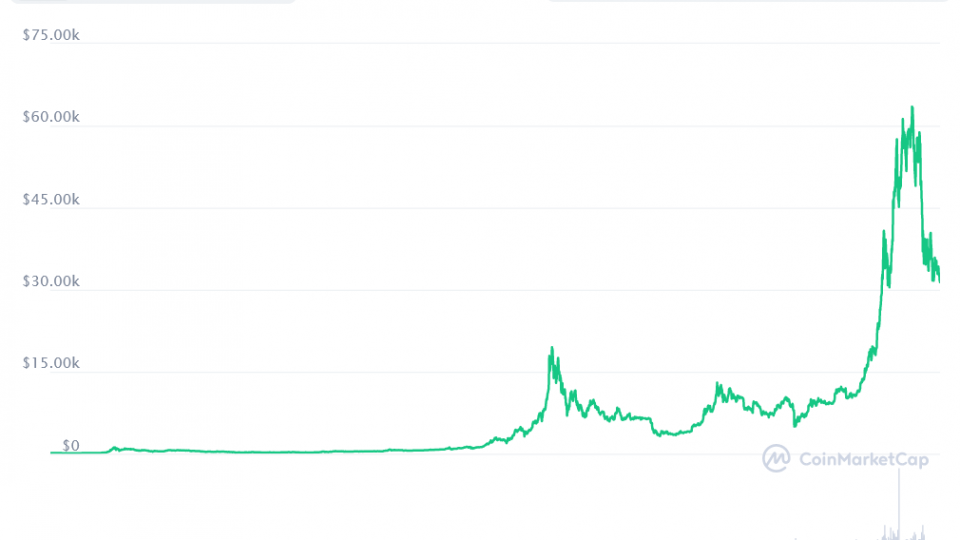
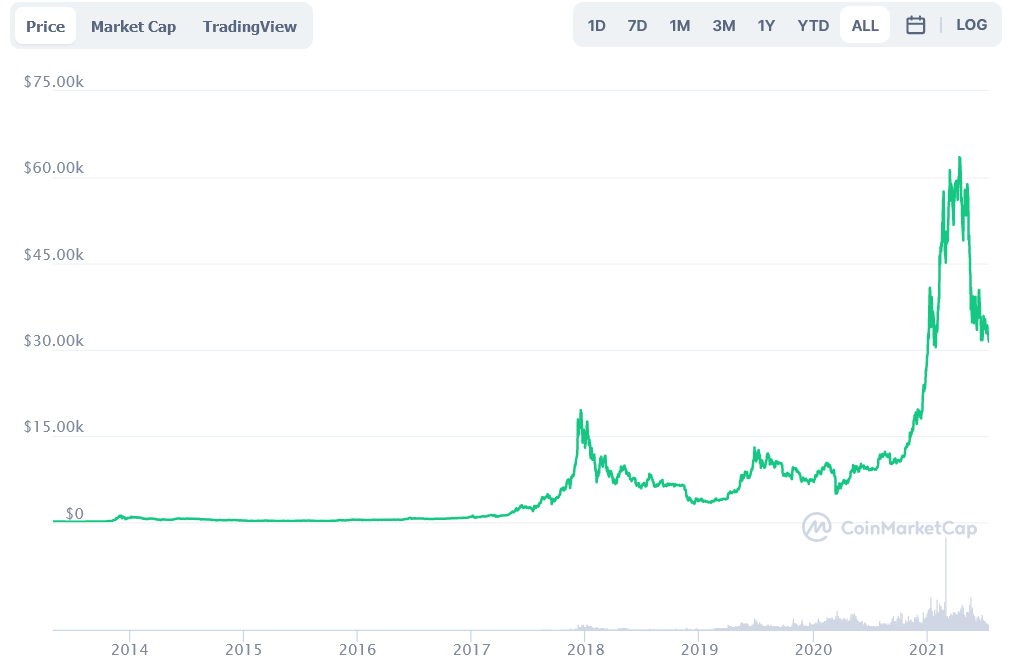
On July 16, Bitcoin (BTC) resumed its downward trend, reaching a low of $31,113. Another validation of the $31,300 support area resulted as a cause of this. It’s currently trading within a short-term descending parallel channel, with a breakout looking like the most likely outcome.
BTC began to fall sharply on July 15th. It first dropped to a low of $31,550, almost hitting the $31,300 horizontal support level. It quickly recovered, reaching a high of $32,820 at the closing.
A long lower wick and a bullish hammer candlestick were generated because of the action (green icon) but again BTC hit a low of $31,113 on July 16. Technical indicators in the daily time are bearish, despite the bullish candlestick and the MACD has issued a negative reversal signal. The bearish cross on the Stochastic oscillator is a good example of this (red icon).
Bitcoin resistance and price analysis
At $40,550, the main resistance area can be found. This is a horizontal resistance area and the 0.382 Fib retracement level. Bitcoin is ranked 1st in cryptocurrency market. Currently, coin’s price is $31,230.40 with trading volume of $23,878,416,776 in the last 24 hours. At the time of writing BTC market cap is standing at $587,847,185,178 along with circulating supply of 18,757,862.00 BTC.
BTC has been trading in a descending parallel channel since June 29, according to the five hours chart. It bounced off the channel’s support line for the third time on July 16th.
The touch, however, occurred below the 0.618 Fib retracement support level and above the 0.786 Fib retracement support level. As a result, BTC does not have Fib support in addition to channel support. The MACD is remains bearish, even though the RSI has generated some bullish divergence.
When measuring from the April 14 all-time high price, bitcoin has 2 options, the first shows that a bearish impulse has been completed and the second option is that BTC is still in wave four and will experience another dip once it is done.
BTC is unlikely to be in wave five now that the wave 2-4 line has been broken. As a result, the first scenario implies that BTC has completed a negative impulse and is now correcting upwards. While the long-term movement would be different in both scenarios, the short-term movement would be comparable.
The entire channel is most likely part of a complex W-X-Y corrective structure. A breakout of the channel would confirm this, and BTC may rise to approximately $40,550, the range highs.
The post Bitcoin (BTC) Has Dropped to a Crucial Support Level with negative parallel trading channel appeared first on Ripple Coin News.
Go to Source
Author: Gracie Perez