

While recent bearish crossovers between Bitcoin’s 50-day and 200-day exponential moving averages failed to push prices lower, this time could be different.
Bitcoin (BTC) formed a trading pattern on Jan. 8 that is widely watched by traditional chartists for its ability to anticipate further losses.
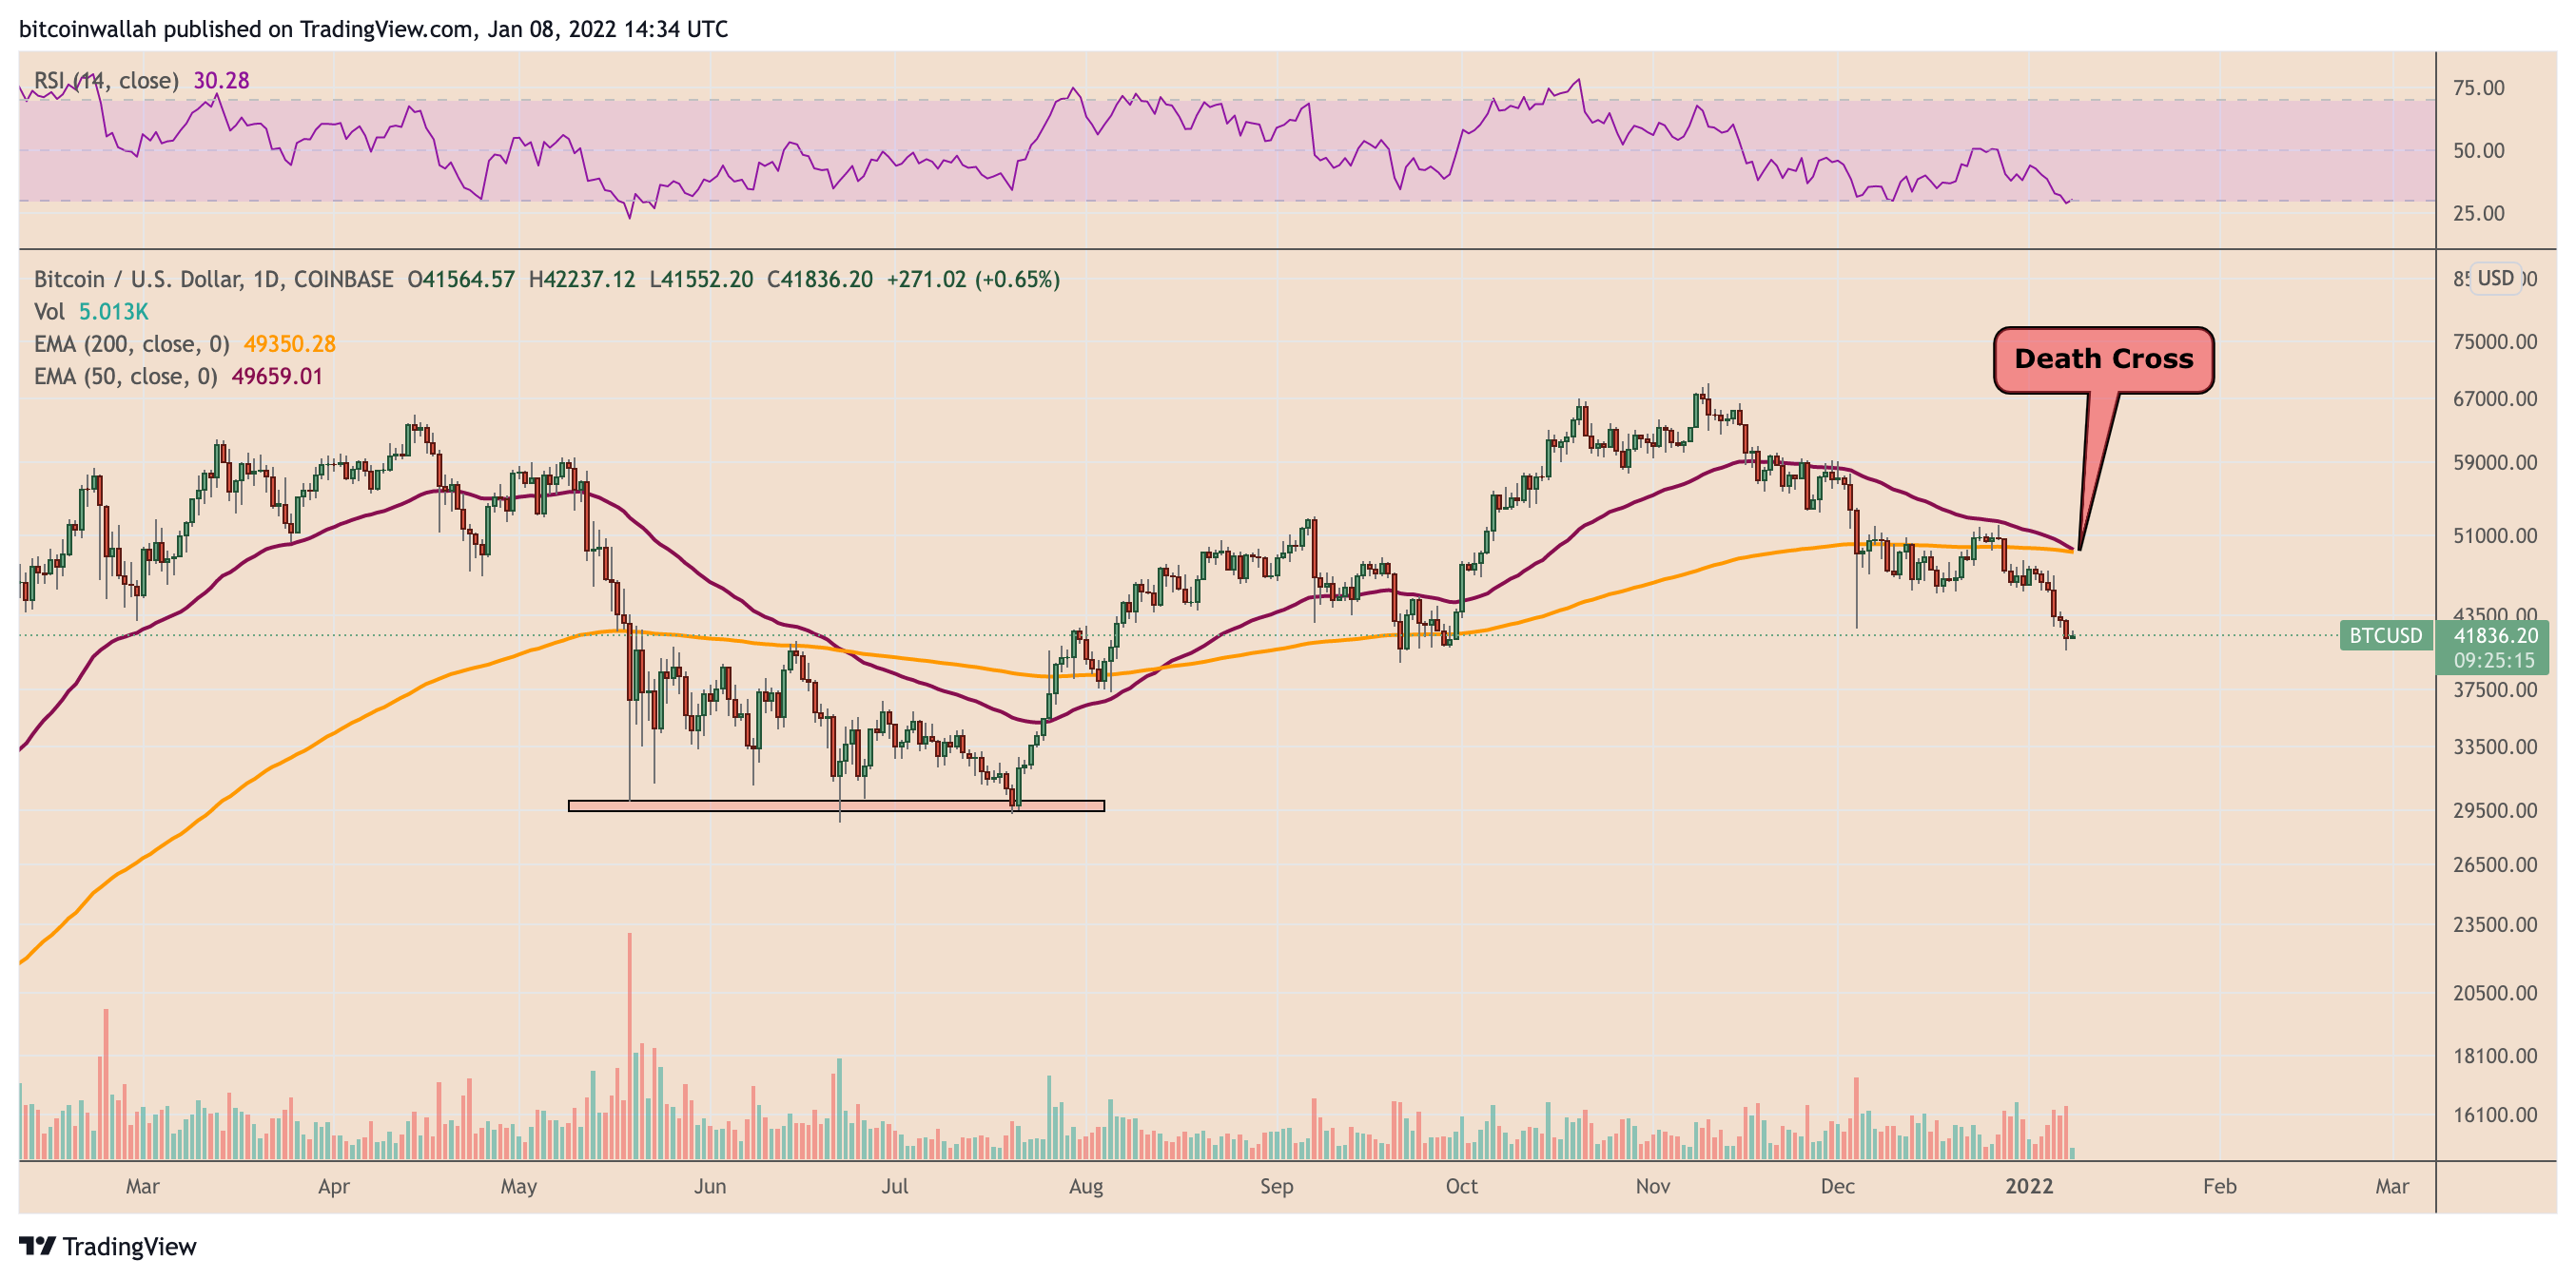
In detail, the cryptocurrency’s 50-day exponential moving average (50-day EMA) fell below its 200-day exponential moving average (200-day EMA), forming a so-called “death cross.” The pattern appeared as Bitcoin underwent a rough ride in the previous two months, falling over 40% from its record high of $69,000.
Death cross history
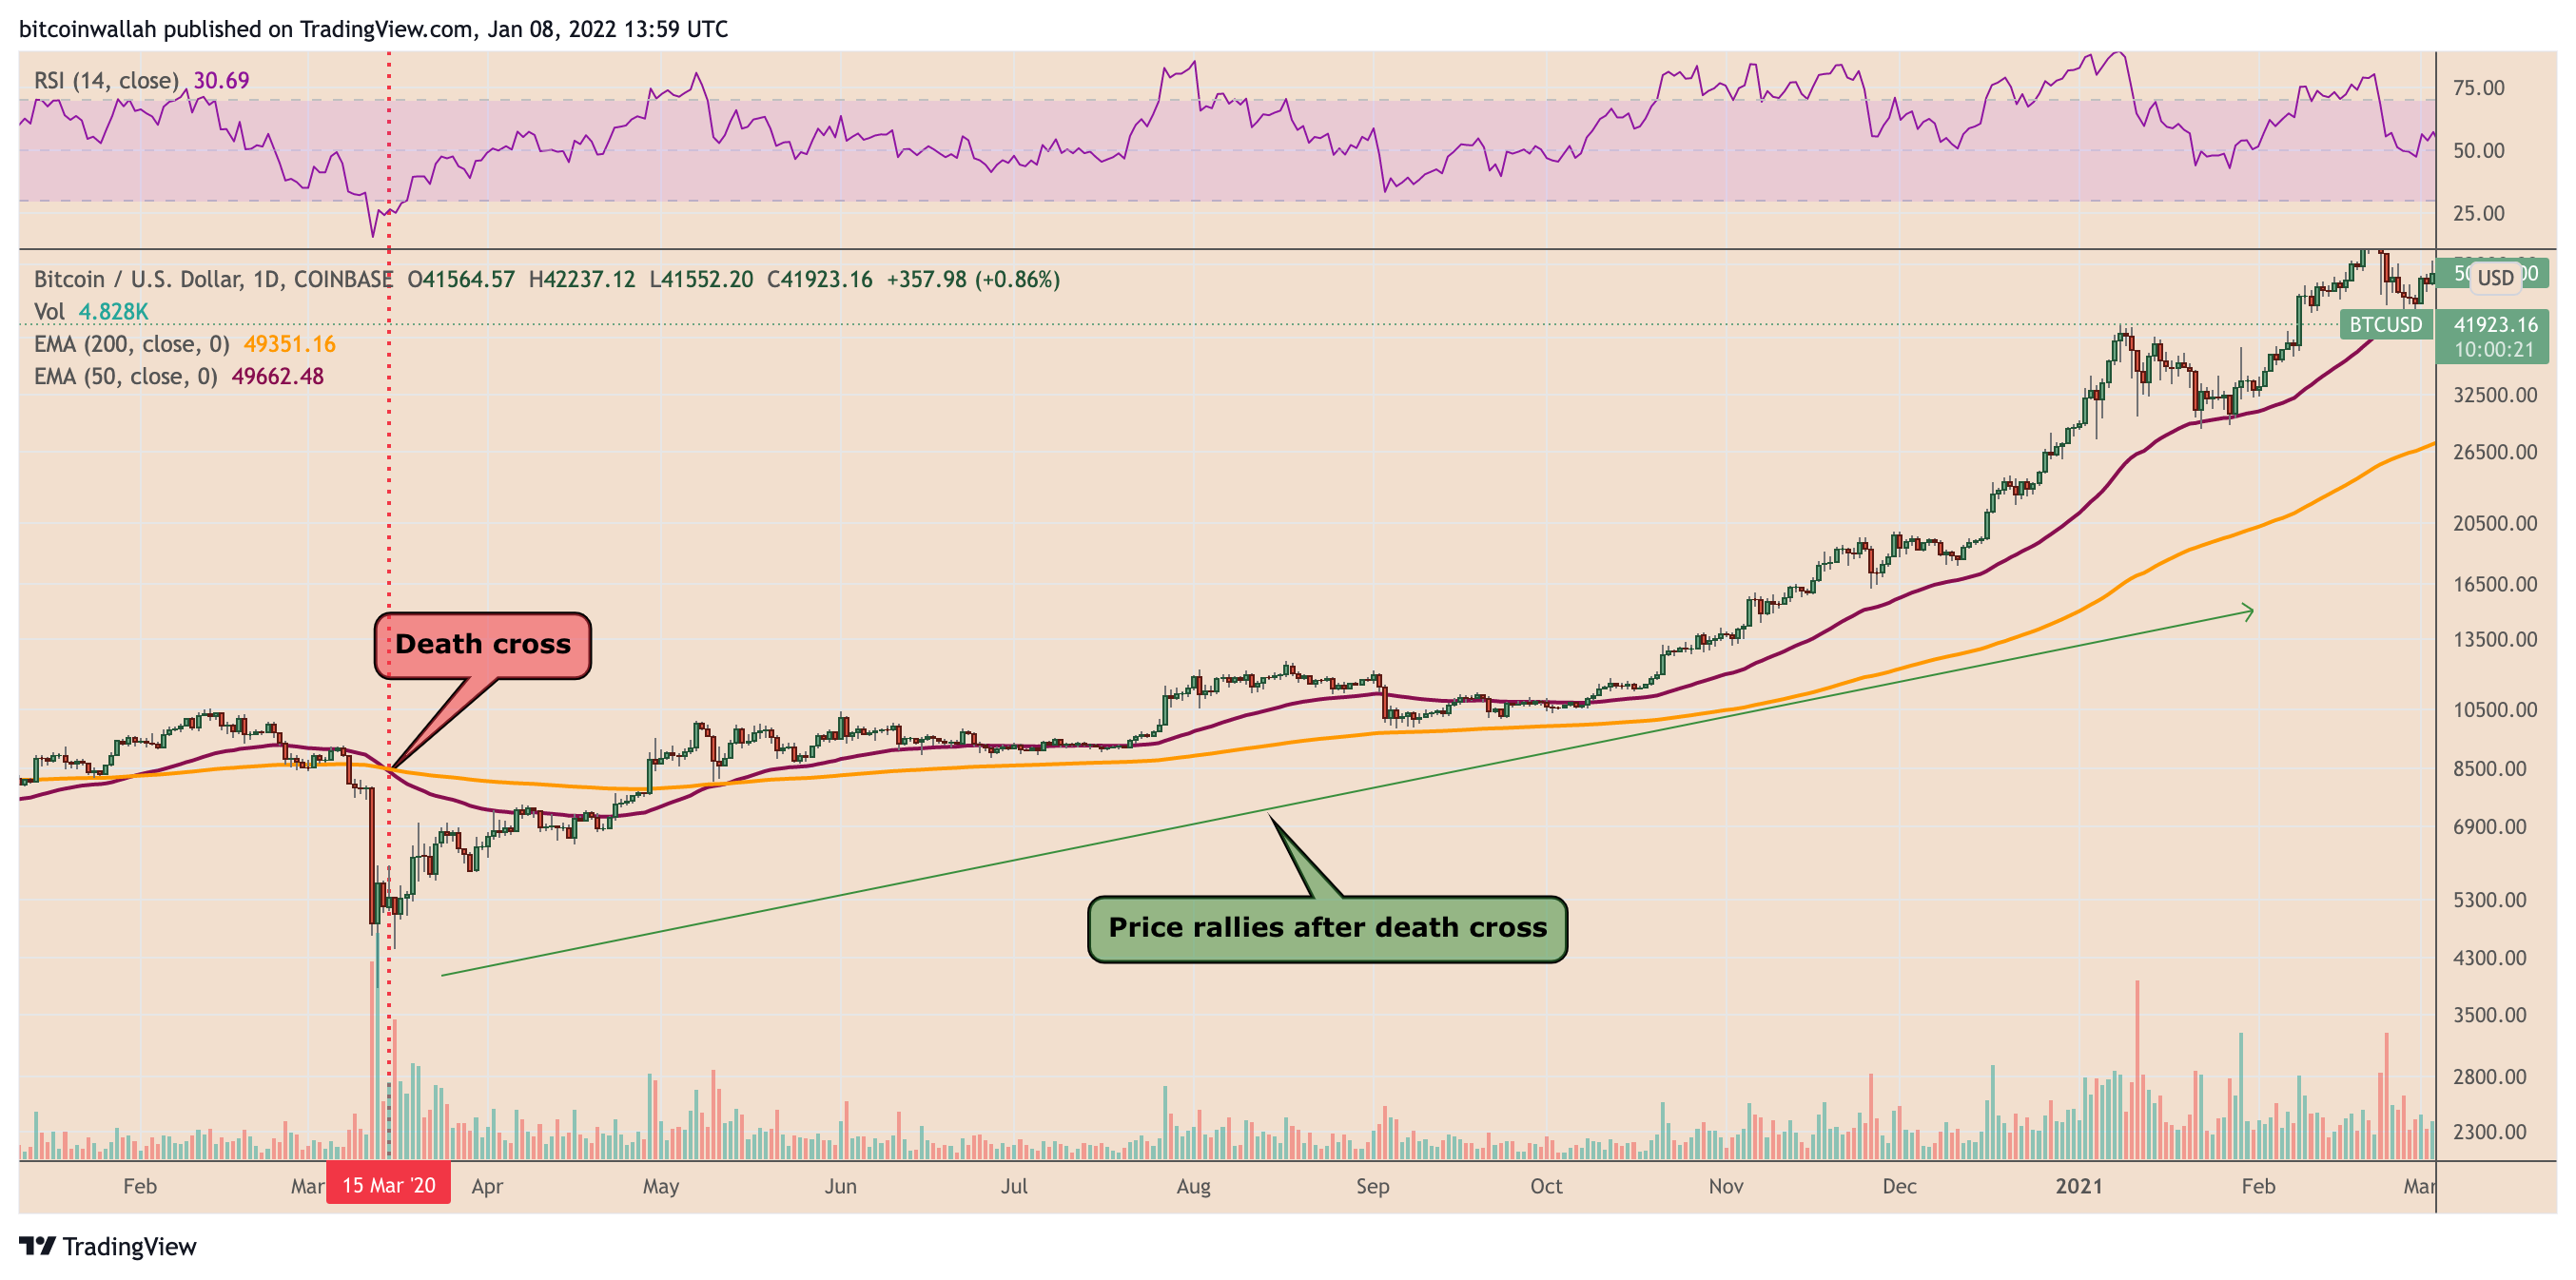
Previous death crosses were insignificant to Bitcoin over the past two years. For instance, a 50-200-day EMA bearish crossover in March 2020 appeared after the BTC price had fallen from nearly $9,000 to below $4,000, turning out to be lagging than predictive.
Additionally, its occurrence did little in preventing Bitcoin from rising to around $29,000 by the end of 2020, as shown in the chart below
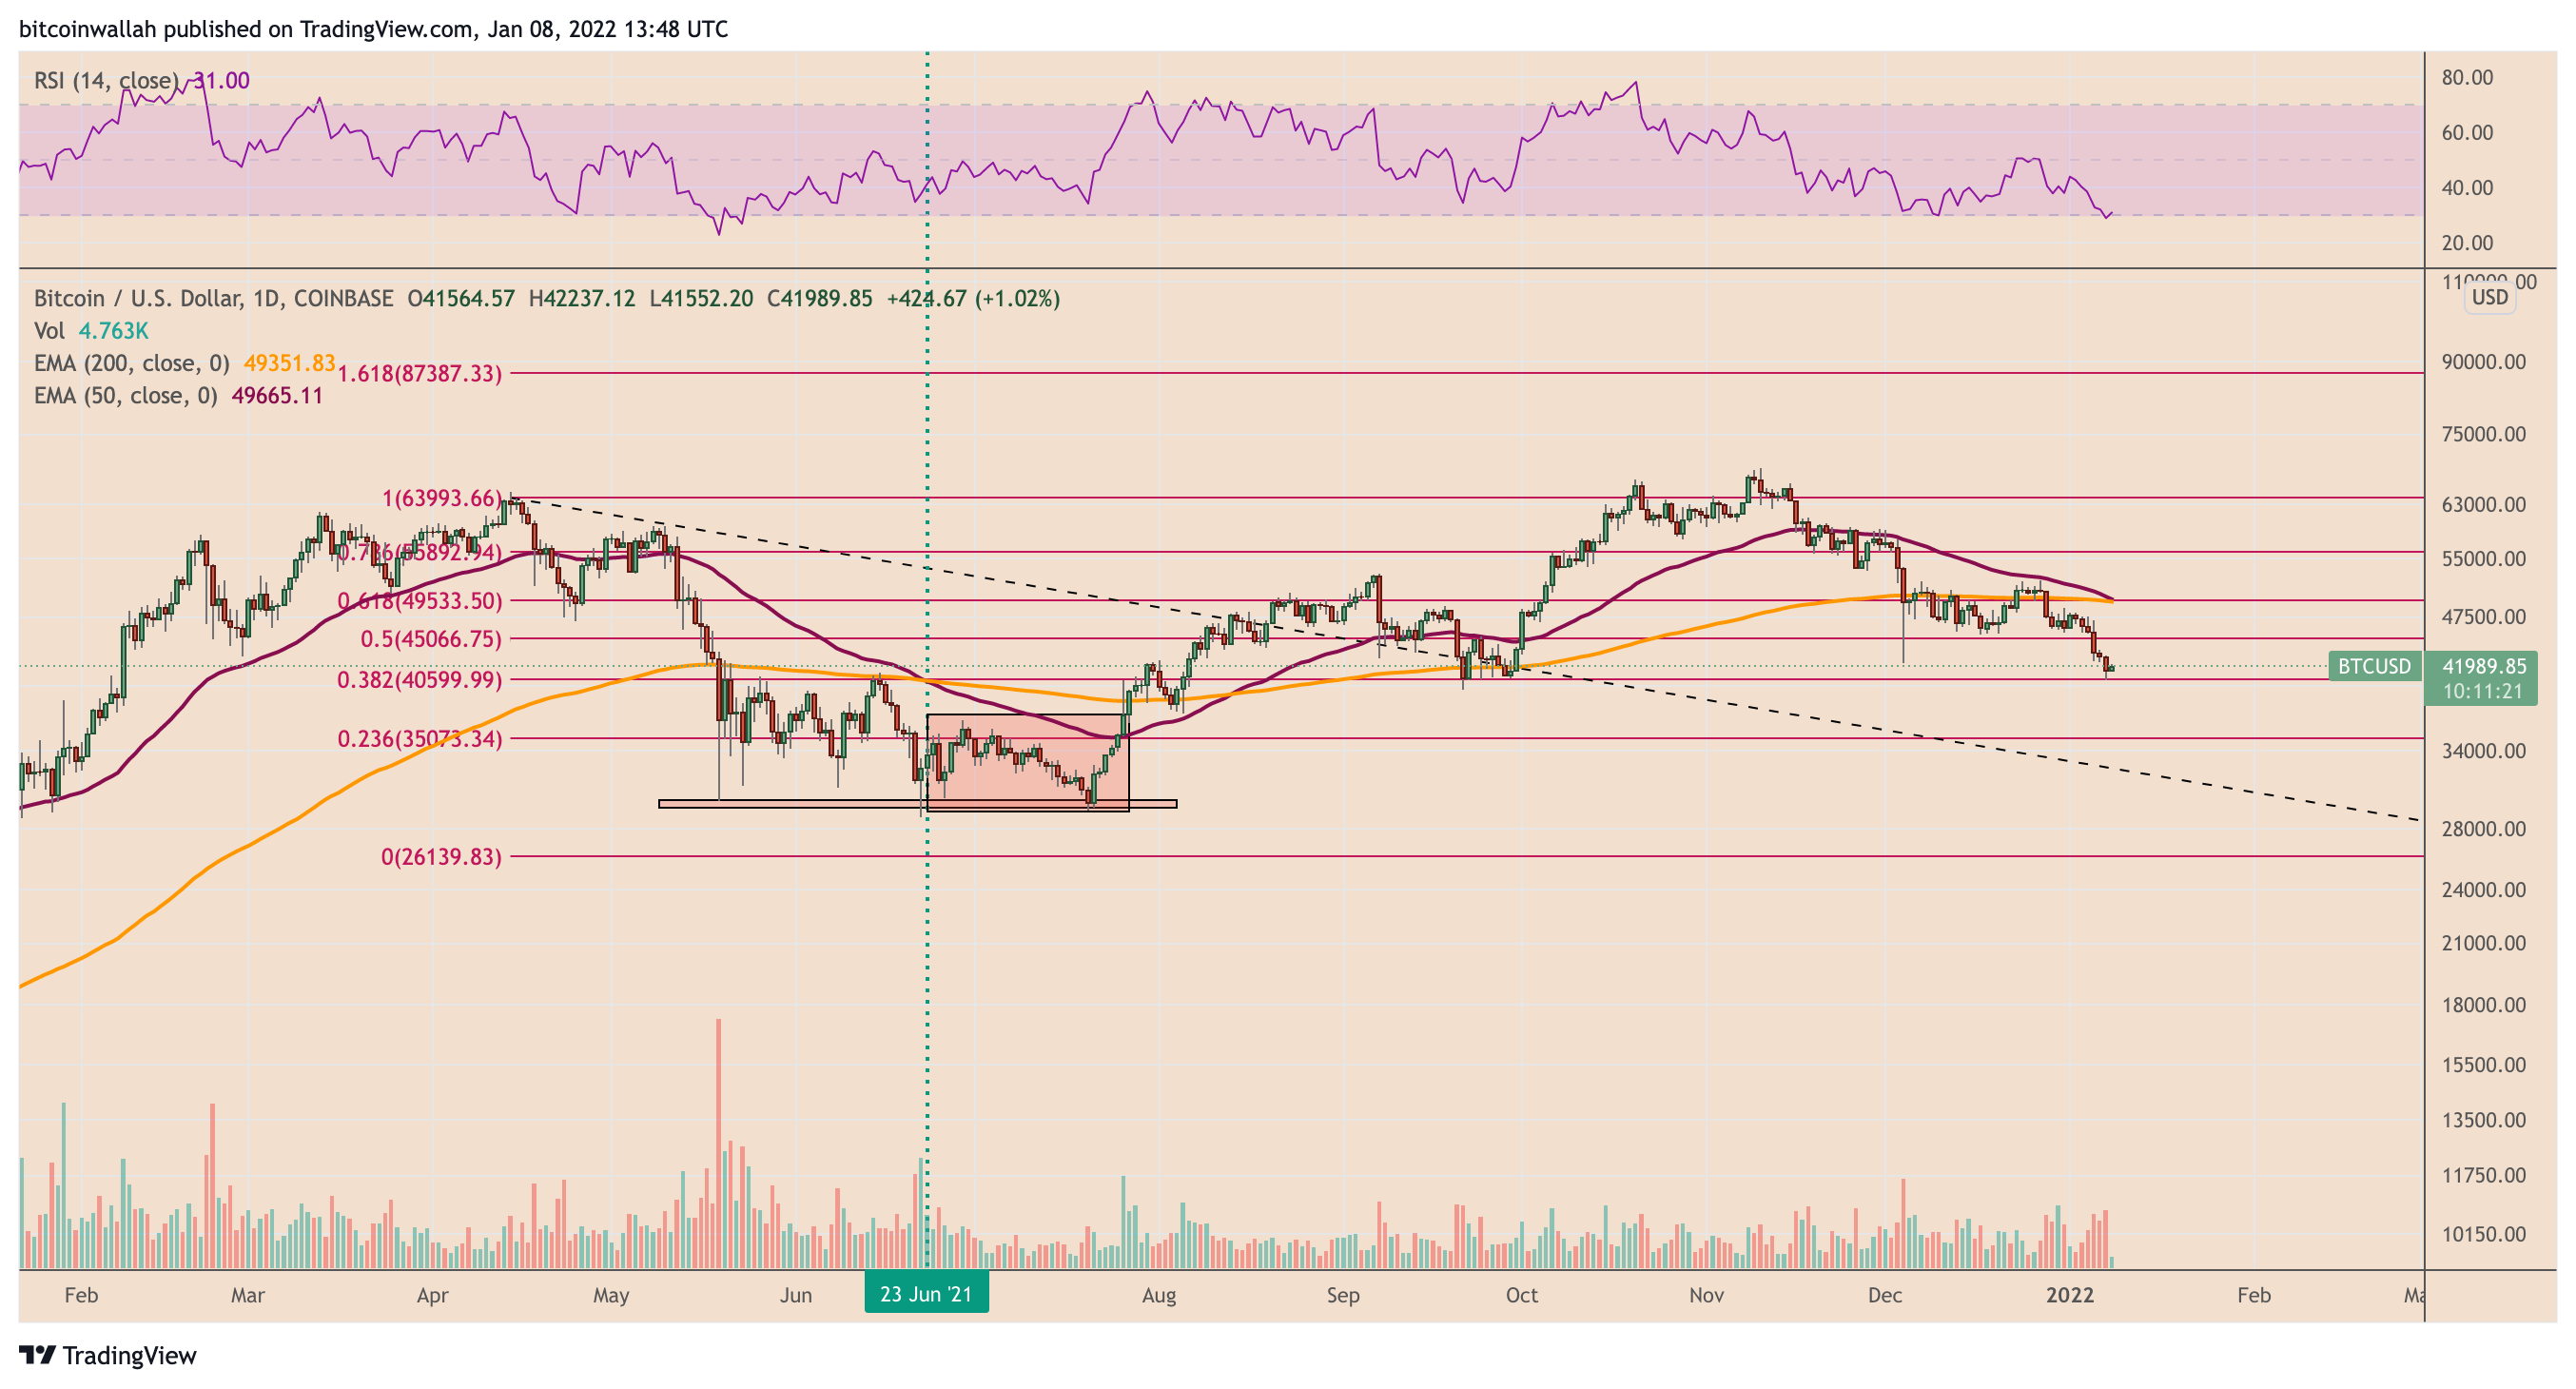
Similarly, a death cross appeared on the Bitcoin daily charts in July 2021 that — like in March 2020 — was more lagging and less predictive. Its occurrence did not lead to a massive selloff. Instead, BTC’s price merely consolidated sideways before rallying to $69,000 by November 2021.
But the bearish moving average crossovers in both the instances, as mentioned above, accompanied a piece of good news, which may have limited their impact on the Bitcoin market.
For instance, the Bitcoin price recovery in July 2021 came majorly in the wake of rumors that Amazon would start accepting cryptocurrencies for payments — that later turned out to be false — and following a conference, dubbed “The B-Word,” which saw Twitter CEO Jack Dorsey, Tesla CEO Elon Musk, and ARK Invest CEO Cathie Wood speaking highly in favor of Bitcoin.
Similarly, Bitcoin recovered sharply from its below $4,000-levels in March 2020, primarily after the U.S. Federal Reserve announced its loose monetary policies to contain the aftermath of the coronavirus pandemic-led stock market crash.
The death cross this time looks dangerous
Bitcoin’s latest decline reflected growing investor concern about the Fed’s decision to aggressively unwind its loose monetary policies—including the dialing back of its $120 billion a month asset purchasing program followed by three rate hikes—in 2022.
Typically, rising interest rates make holding volatile assets like Bitcoin less appealing than government bonds, which offer guaranteed yields.
“This is proof that bitcoin acts like a risk asset,” Noelle Acheson, head of market insights at crypto lender Genesis Global Trading, told the Wall Street Journal, adding that the short-term holders would be the “closest to the exit.”
Related: Bitcoin may pass $30K September lows, trader warns
As a result, the overall reduction in cash liquidity, coupled with the death cross formation, could trigger further selloffs in the Bitcoin market. However, that is unless the BTC price rebounds from its current support level around $40,000, the 0.382 Fib line shown in the chart below.
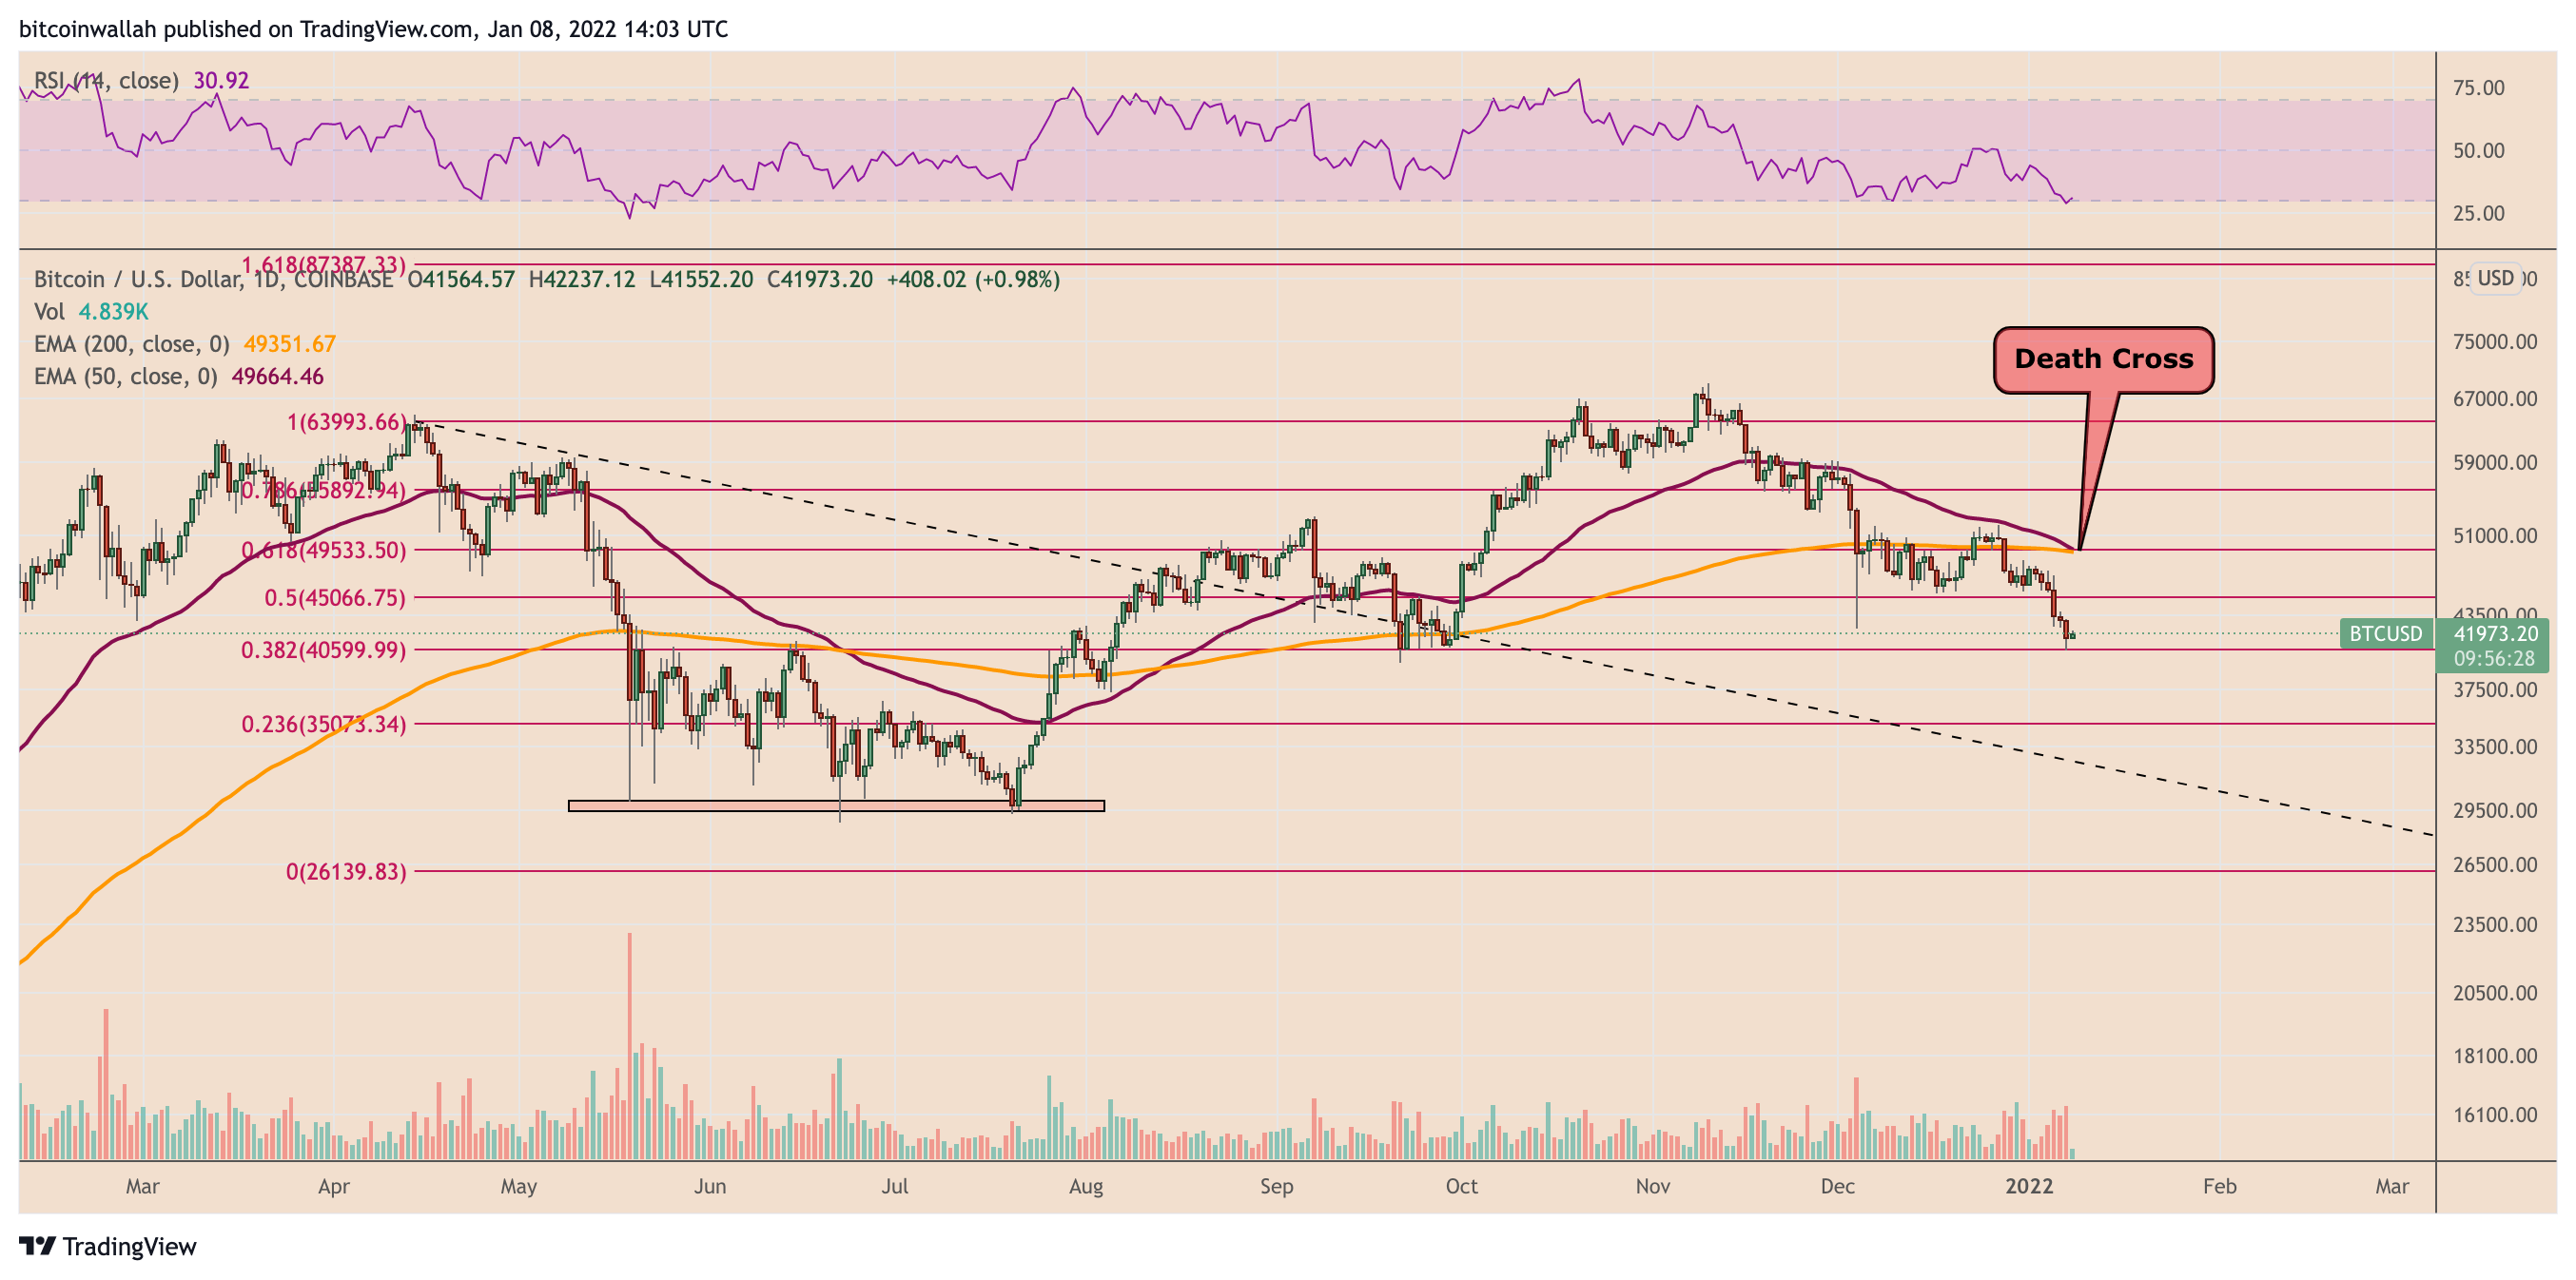
Nonetheless, a break below $40,000 may risk sending the Bitcoin price to the next Fib line support near $35,000.
The views and opinions expressed here are solely those of the author and do not necessarily reflect the views of Cointelegraph.com. Every investment and trading move involves risk, you should conduct your own research when making a decision.
Go to Source
Author: Yashu Gola