Ethereum’s Environmental Footprint: Breaking Down the Misconceptions
By Yorke E. Rhodes III, EEA Board Member and Co-Founder blockchain @Microsoft
There’s no denying that blockchain, Ethereum, non-fungible tokens (NFTs) and the entire ecosystem surrounding them have been maturing quickly and gaining traction with a mainstream audience. However, while the space continues to amass loyal and enthusiastic supporters, concern around its carbon footprint has also emerged. In particular, there is a fair amount of negative chatter, and some validity, about the carbon footprint of Bitcoin, a Proof of Work (PoW) based system.
That said, most brands don’t utilize Bitcoin for NFT creation and transactions. Instead, they use Ethereum, the second largest (by various measures) public blockchain, and Layer 2s (L2s) or sidechains such as Palm, both of which are running vastly more carbon friendly protocols. In fact, there exists a widespread misconception about the magnitude of the environmental impact of Ethereum transactions. A closer look at the numbers reveals that many transactions – specifically those related to minting and selling NFTs – have no greater impact than many common daily activities that are accepted without question when performed on L2s or sidechains.
Look to Layer 2
First, it is important to note that the Ethereum Foundation recommends conducting all NFT related transactions on L2 networks, such as Palm, Polygon and others. There’s good reason for this. While Layer 1 (L1) technologies operate at around 16 transactions/second, L2 transactions run at closer to 10,000 transactions/second, a throughput that is far more conducive to the volume of transactions that NFT minting and selling requires. There are currently about five approaches to L2 on Ethereum, so the technology is out there and ready for use. It’s time for more users to adopt L2, which not only produces faster results, but significantly cuts down on impact per transaction. The following look at Ethereum’s effect on the environment assumes that users are deploying on L2, which is the way forward for the Ethereum community.
Breaking Down the Numbers
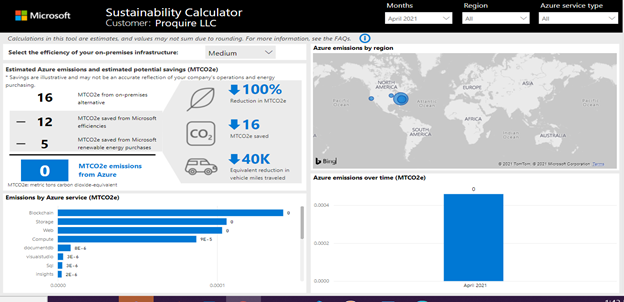
Let’s take a moment to crunch a few numbers and dive into the details of Ethereum’s carbon footprint, with a focus on NFT transactions as a key example. There are several tools designed to help companies gain an understanding of their work’s impact. Our experiment begins with the Microsoft Azure Sustainability Calculator, which allows businesses to calculate the footprint of their Azure cloud workloads. A brand running a number of workloads could run this calculator and understand the footprint of everything they’re doing on Azure, including how Microsoft is helping them address their impact through carbon mitigation activities.
Take a look at the chart below. The first line item on the left – a value of 16 – indicates emissions for a given workload. The second two items below that line are different types of mitigations conducted by Microsoft – efficiencies for cloud and energy purchases. As a result, the environmental impact for the below example workload comes out to zero.
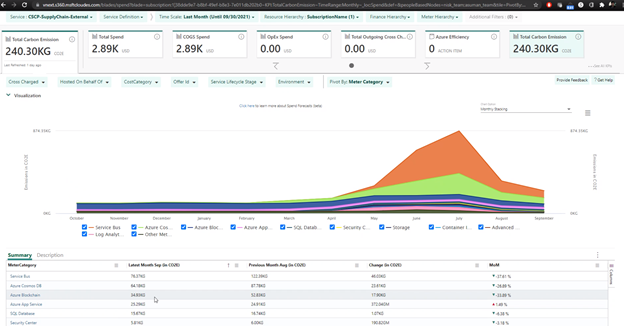
While this provides an example of a company’s net environmental impact in Azure, the obvious complication is that it incorporates all of Microsoft’s activities to offset emissions, which doesn’t help deliver a clear understanding of the basic footprint of a company’s actions. Given this, we also explored another tool called CloudFit, which provided more raw data about the underlying workload and its impact. The chart below comes from CloudFit and shows an example blockchain workload of about 35KG CO2e. We then utilized the Greenhouse Gases Equivalencies Calculator, which is published by the EPA, to show some common equivalencies. In this case, the impact of running this blockchain node workload for a month is roughly equivalent to charging your smartphone twice – an activity that hasn’t received the same kind of environmental scrutiny.
 Anecdotally, Palm recently published a blog that indicates an NFT transaction on the Palm network is roughly equivalent to sending three emails. Given the volume of email versus the volume of transactions of an NFT over its life, it’s safe to say that the NFT footprint compares quite favorably.
NFTs vs. Your Cell Phone
On the topic of NFTs, let’s explore what the footprint of an NFT drop might look like with the following calculations. In this scenario, we’re considering a drop of one million NFTs on Palm, an Ethereum sidechain, and assuming an average of 2.5 transactions per year per NFT. This includes the original mint of the NFT, the initial purchase and another 1.5 sales on average, an estimate which is on the high end. Given these parameters, we’re looking at 2.5 million transactions for our pool of one million NFTs.
1M NFTs x 2.5 transactions = 2.5M transactions
When you add in the mint, which is the original transaction, you have 3.5 M transactions for the year for that collection.
2.5M transactions + 1M mints (transactions) = 3.5 M total transactions
Looking at impact per transaction for a business involves understanding the total blockchain network baseline to sustain it, calculating estimated impact per transaction on the network based on capacity, then using that to assess the business workload based on this impact per transaction estimate.
Calculating energy/transaction for the Palm network suggests a 2.5×10⁻⁶ kWh footprint per transaction. Using that, you can calculate that 3.5 million transactions in a year for this NFT launch results in 8.75 kWh.
2.5×10-6 kWh x 3.5M = 8.75 kWh
Now, using the EPA Calculator, we can see that 8.75 kWh is essentially equivalent to 729 smart phone charges. Assuming you charge your phone once per day, you can now determine that the minting and selling of this NFT collection over the course of a year is equivalent to charging two smartphones for the same period.
There is more analysis to do here on the history of transactions for the cryptocurrencies used to make the purchase of an NFT, which will be addressed in a future blog. There is also some work to understand the footprint of fiat currencies, such as USD, used for purchase of an NFT. In the case of the Palm network, it is estimated that 85% of the purchases of NFTs are done using a fiat currency. We will assess both in a later blog.
The Move to PoS
While the above calculations help shed some light on the true impact of Ethereum transactions and how they compare to many mundane and accepted activities, they are unlikely to persuade the die-hard doubters looking to attack the space. However, there is change afoot that has the potential to truly silence the naysayers. Ethereum was launched as a PoW system in July 2015, but its Mainnet network has always had a plan to move to a lower carbon intensity protocol called proof of stake (PoS). This transition, which is underway and expected to complete in mid 2022, would enable Ethereum to separate itself even further from the negative footprint associations that come with PoW, which I touched on at the start of this blog. The bottom line is clear: as evidenced by the calculations above, Ethereum’s impact when using layer 2s is less extensive than often thought, finite, and within a matter of months will be virtually nonexistent.
Watch this space for more on the topic of sustainability, as it’s a topic we’ll continue to explore in upcoming posts.
Stay up to date on everything EEA by following us on Twitter, LinkedIn, and Facebook.
The post Ethereum’s Environmental Footprint: Breaking Down the Misconceptions appeared first on Enterprise Ethereum Alliance.
Go to Source
Author: Sofya Howard